The $2.52 Burger - Big Mac Price in Indonesia Tell Us
The $2.52 Burger: What Indonesia's Big Mac Tells Us About the World's Most Misunderstood Economy
In January 2026, a teenager in a Jakarta shopping mall walked up to a McDonald's counter and ordered a Big Mac. She paid 42,000 Indonesian rupiah — about $2.52 at the day's exchange rate. That same month, in a McDonald's on Sixth Avenue in Manhattan, a construction worker paid $6.12 for the same sandwich. Same sesame-seed bun. Same two all-beef patties. Same special sauce. The only difference was the number on the receipt — and the entire economic universe behind it.
That gap — $2.52 versus $6.12 — is not just a quirk of international pricing. According to The Economist's Big Mac Index, updated every January and July since 1986, the Indonesian rupiah is 58.9% "undervalued" against the US dollar on a raw price basis. Adjust for Indonesia's lower income levels using GDP per person, and the rupiah still looks 45.9% too cheap. On the Big Mac Index's signature dot chart, Indonesia sits deep in red territory, clustered with Egypt, India, and Taiwan on the far left of the undervalued spectrum — a long way from the blue dots of Switzerland, Norway, and the eurozone.
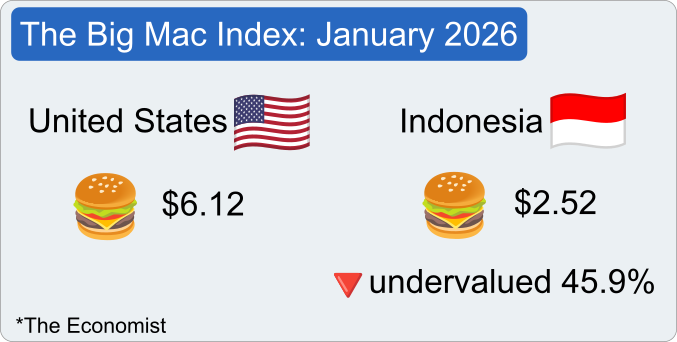
A Big Mac costs $2.52 in Indonesia and $6.12 in the United States. Based on GDP per person, the rupiah looks 45.9% undervalued. Indonesia sits deep in the red.
The Big Mac Index was invented as a joke. In September 1986, Pam Woodall, then a writer at The Economist, proposed using the price of a McDonald's hamburger as a quick-and-dirty test of a grand economic theory: purchasing power parity (PPP), the idea that identical goods should cost roughly the same across countries once you convert currencies. She compared Big Mac prices in 13 countries and published the result as a tongue-in-cheek thought experiment. Nearly four decades later, the index covers more than 70 countries, has been cited in academic papers and central bank reports, and has become, as Britannica puts it, "a lighthearted but surprisingly useful gauge of currency valuation." The joke turned into a thermometer.
But what does the thermometer actually measure when it points at Indonesia? Not just prices. Not just exchange rates. It measures the accumulated weight of history — a financial crisis that destroyed a government, a commodity boom that reshaped global supply chains, the gravitational pull of the US Federal Reserve on a currency 10,000 miles away, a trade war that nobody expected, and the ambitions of the world's fourth-most-populous nation trying to claw its way from middle income to prosperity.
The rupiah's "undervaluation" is not a flaw to be corrected. It is a map of everything that has shaped — and continues to shape — the economic life of 284 million Indonesians. To read it properly, you have to start where the story starts: with the worst economic crisis in Indonesia's modern history.
The Ghost of 1998
To understand why the rupiah is where it is today, you have to understand where it has been. And where it has been is the floor.
In December 1996, one US dollar bought about 2,400 Indonesian rupiah. The Indonesian economy was humming along at around 8% annual growth, the envy of development economists everywhere. President Suharto, the country's authoritarian ruler since 1967, had presided over three decades of rising incomes and falling poverty. Foreign capital poured in. Banks lent freely. Private companies borrowed billions in US dollars without hedging — meaning they bet, implicitly, that the rupiah would stay strong. It was, as Indonesia Investments describes it, "a time bomb waiting to explode."
The fuse was lit in Thailand. In July 1997, the Thai baht collapsed after the government ran out of foreign reserves to defend its peg to the dollar. Contagion spread across Southeast Asia like a forest fire. When it reached Indonesia, it found the driest tinder: a banking sector riddled with nonperforming loans, crony capitalism, and a mountain of unhedged private-sector dollar debt. By January 1998, the rupiah had fallen to 16,000 per dollar — losing more than 85% of its value in barely six months. At its worst, in June 1998, the currency briefly touched 16,800.
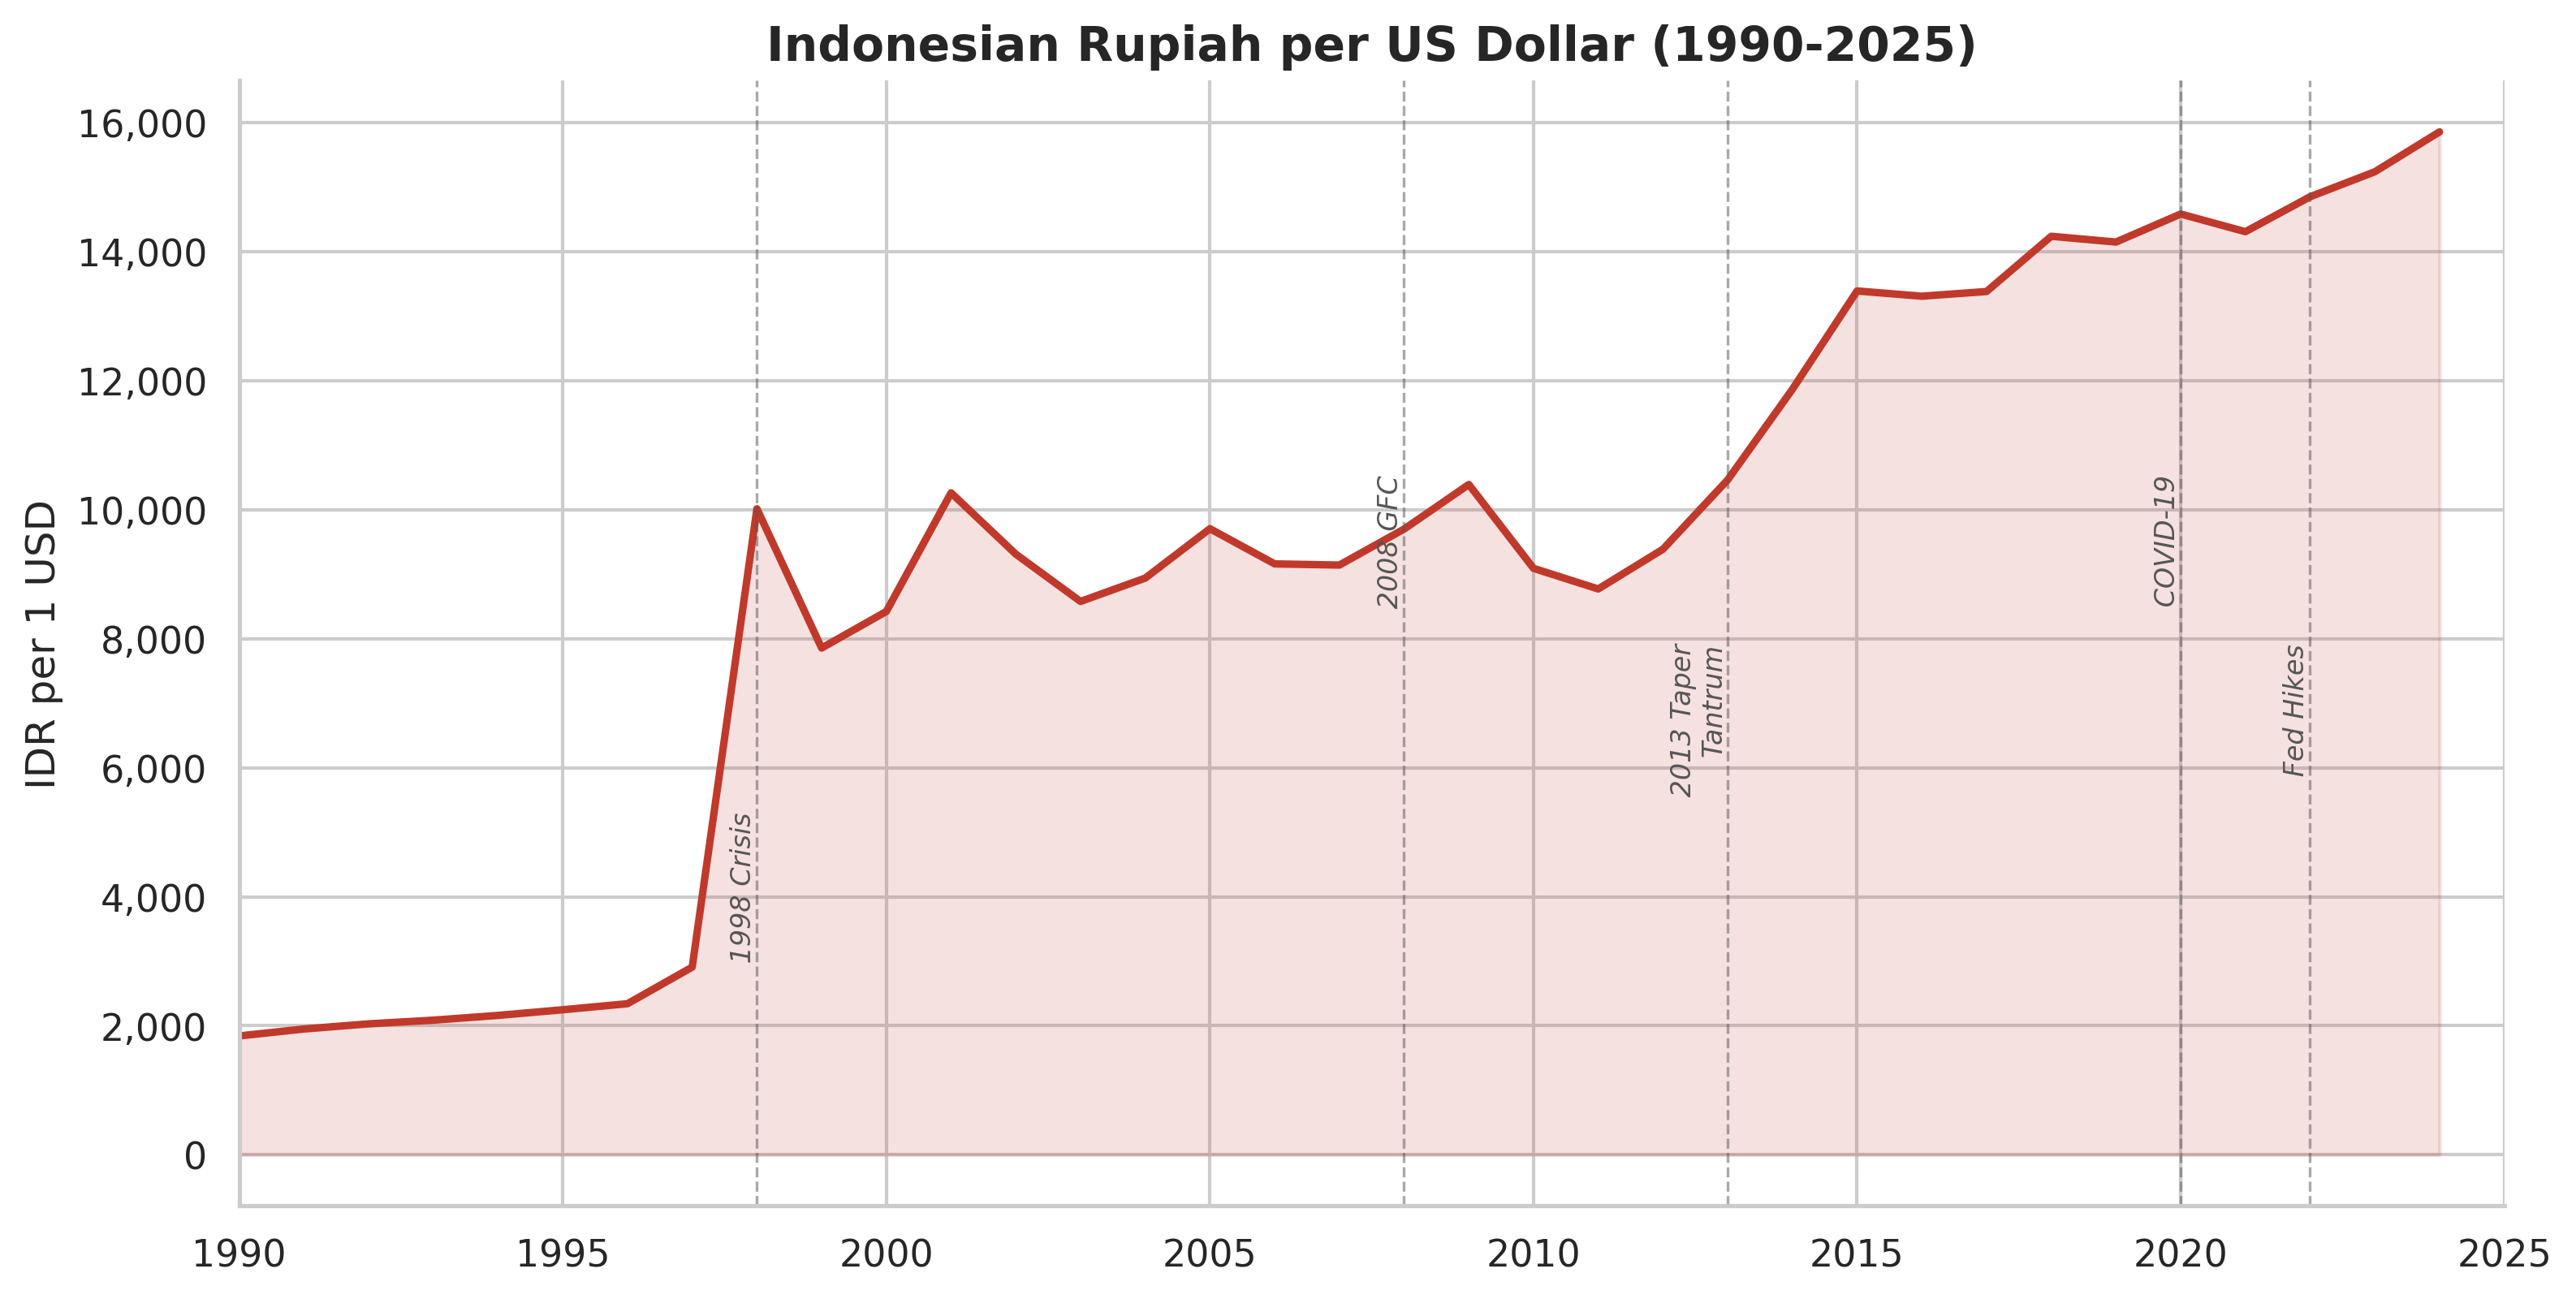
That cliff in 1998? The rupiah lost 85% of its value in six months. It has never gone back.
Look at the chart. Start on the left, around 1990, where the line sits close to 2,000 — a flat, quiet trajectory that barely rises through the mid-1990s. Indonesia's managed exchange rate was holding steady, and the line reflects the confidence of an economy that thought it had figured things out. Then comes 1997. The line doesn't rise gradually. It goes vertical — a near-perpendicular spike from roughly 2,400 to over 10,000 in the space of a single data point. That is what a currency collapse looks like when it happens to the world's fourth-most-populous country.
What happens after the cliff is almost as revealing. The rupiah recovers partially, dropping back to around 8,000 by 2000 — but it never returns to its pre-crisis level. From 2000 to 2011, the line forms a kind of plateau, oscillating between 8,000 and 10,000, steady enough to suggest stability had returned. Then, starting around 2013 — the year of the Fed's "taper tantrum" — the line begins a slow, steady ascent: 10,000, then 13,000, then 14,500. COVID-19 causes a visible bump in 2020. The Fed's rate hikes in 2022 push it higher still. By 2025, the line has reached 16,000 — higher than the 1998 crisis peak in terms of the annual average. The rupiah, in other words, has never really recovered. It stabilized. It grew. But it never went home.
The economic devastation was biblical. Indonesia's GDP contracted by 13.5% in 1998, the steepest fall of any major Asian economy during the crisis. Inflation rocketed to 58%. The price of rice doubled. The price of cooking oil tripled. In a country where half the population lived on less than two dollars a day, these were not abstractions. As the National Bureau of Economic Research documented, the crisis pushed millions of Indonesians back into poverty, erasing years of progress in a matter of months.
Then came the political earthquake. In January 1998, the International Monetary Fund agreed to a $43 billion bailout package — the largest in the IMF's history at that point. The conditions were brutal: bank closures, subsidy cuts, structural reforms. The photograph of IMF Managing Director Michel Camdessus standing with his arms folded over President Suharto as the president signed the agreement became an enduring symbol of national humiliation. Students took to the streets. In May 1998, riots swept Jakarta and other cities. On May 21, after 31 years in power, Suharto resigned.
The human toll defied statistics. In the early months of 1998, the price of basic foodstuffs — rice, cooking oil, eggs — doubled and tripled almost overnight as the rupiah's collapse made imported inputs ruinously expensive. Factories closed. Construction projects halted. An estimated 20 million people were thrown out of work. In a country without unemployment insurance or a meaningful social safety net, losing a job meant losing everything. Families in Jakarta's middle class, who had spent the 1990s buying televisions and motorcycles on credit, suddenly found themselves unable to afford milk. The social fabric frayed. Ethnic Chinese Indonesians, long a target of populist resentment for their outsized role in commerce, faced violent pogroms in May 1998 — looting, arson, and worse. The scars of those weeks remain visible in Indonesia's political culture to this day.
The crisis scarred Indonesia in ways that still show up in the data today. Bank Indonesia, the central bank, became obsessively cautious about foreign exchange reserves, building them from near zero in 1998 to over $130 billion by the 2020s. The government adopted strict fiscal rules, capping budget deficits at 3% of GDP. And the country's monetary authorities embraced inflation targeting in 2005, gradually bringing annual price rises down from the double-digit swings of the 1990s to a steady, almost boring band around 2-3% in the 2020s. The Indonesian rupiah never returned to 2,400 per dollar. It settled into a range of 8,000 to 16,000 over the next quarter century — weaker than its pre-crisis level, but stable enough for an economy that had learned, in the hardest possible way, the cost of complacency.
The Commodity Colossus
If the 1998 crisis explains why Indonesia's currency is weaker than it once was, the country's commodity story explains why it isn't weaker still.
If you fly over the Indonesian archipelago — 17,000 islands strung across the equator like a broken necklace — you are looking at one of the most resource-dense pieces of real estate on the planet. Indonesia sits on an embarrassment of natural riches. It is the world's largest exporter of palm oil, the second-largest exporter of thermal coal, a major producer of tin, rubber, and cocoa — and, crucially, the planet's dominant source of nickel, a metal that has become indispensable to the electric vehicle revolution.
The nickel story is the most dramatic. In January 2020, Indonesia banned the export of raw nickel ore, a move that drew immediate protests from the European Union, Australia, and other trading partners. The World Trade Organization ruled in November 2022 that the ban violated Indonesia's trade obligations. Jakarta shrugged. The strategy, known as "downstreaming," aimed to force foreign companies to process nickel inside Indonesia rather than shipping raw rock to smelters in China or elsewhere. And it worked. Indonesia's share of global nickel supply climbed from 31.5% in 2020 to 60.2% by 2024. Nickel export value surged from roughly $1 billion to $20 billion within two years. In July 2024, Hyundai and LG opened Indonesia's first EV battery cell plant, linking mineral extraction to high-value manufacturing in a single industrial park.
The bet came with costs. Western Australian nickel mines, unable to compete with Indonesia's lower-cost processing, shut down en masse. Indonesian workers in the nickel smelters — many operated by Chinese companies — faced hazardous conditions. And the strategy's success is now so total that it has created a new vulnerability: if nickel prices crash, or if the EV transition slows, Indonesia will feel it harder than anyone.
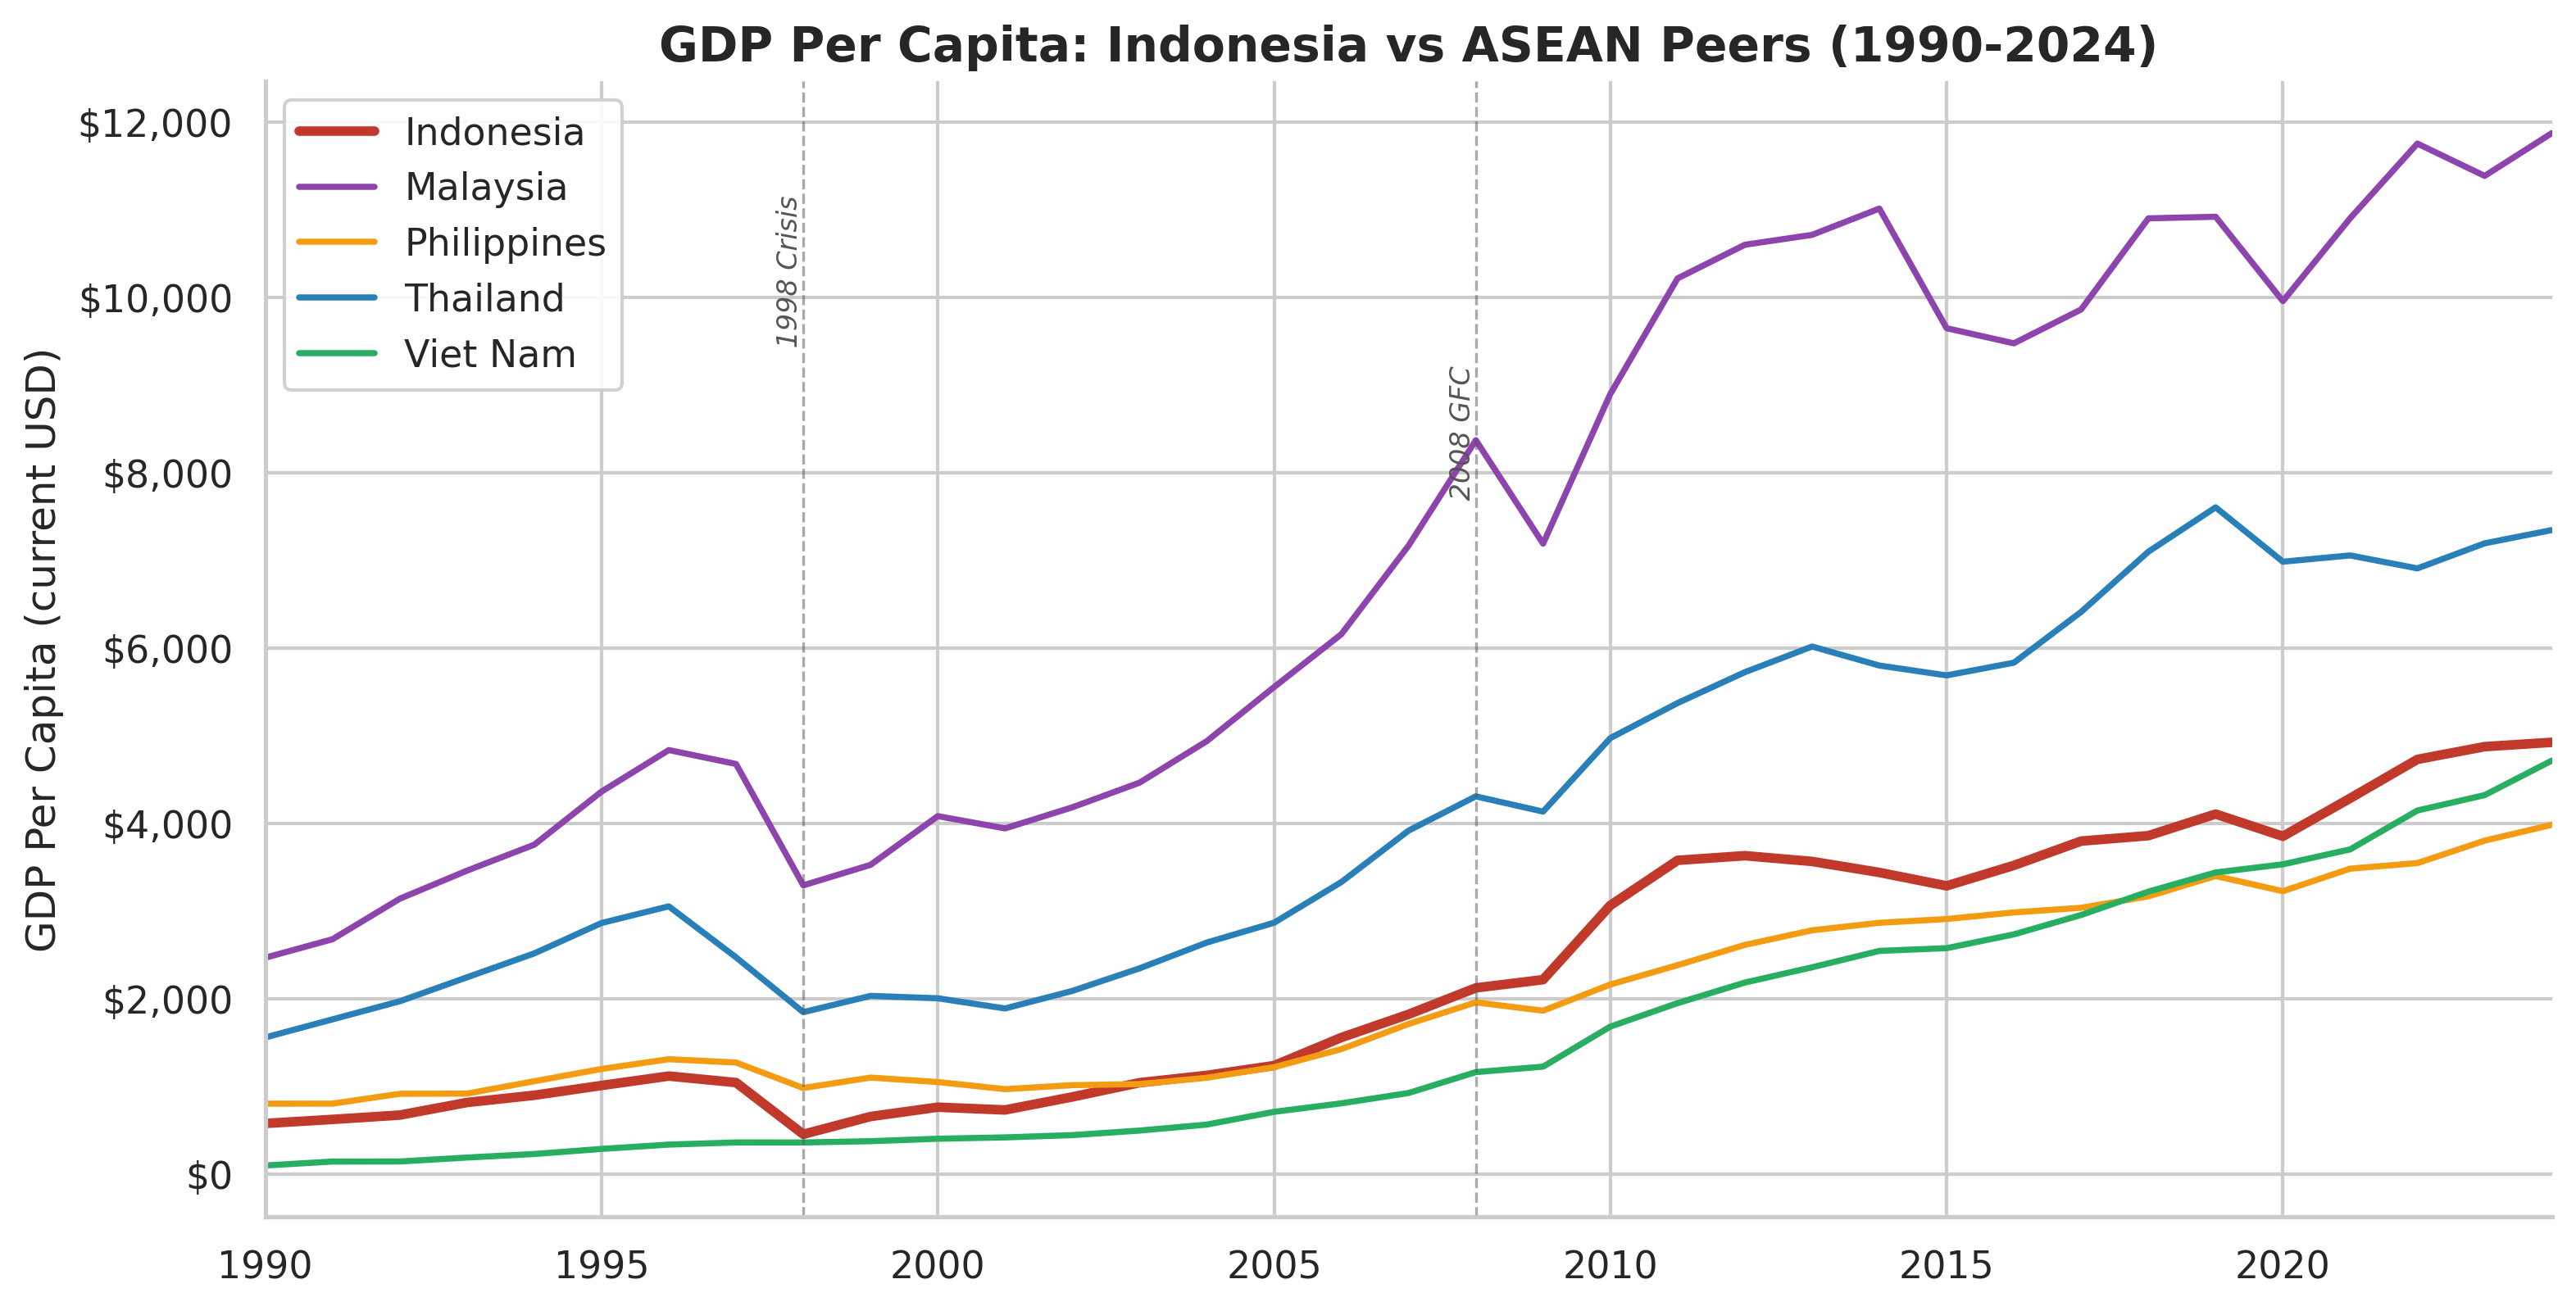
Malaysia leads, Thailand follows, and Indonesia tracks just above the Philippines. But look at Vietnam — the line climbing fast from below.
Start at the top of the chart. The purple line — Malaysia — dominates the vertical space, rising from around $3,000 in 1990 to nearly $5,000 before the 1998 crisis punches it down to $3,300. It recovers and climbs steadily to about $12,000 by the early 2020s. Malaysia is the chart's high achiever, the line that stays above everyone else for three decades straight.
Now look at the blue line: Thailand. It tracks a nearly parallel path, rising from $1,500 in 1990, getting slammed in 1998 just like Malaysia, and then recovering more slowly. By 2024, Thailand sits around $7,500 — solidly middle-class in global terms, but well below Malaysia.
Indonesia is the red line, and it tells a more humble story. It starts around $700 in 1990, barely visible above the bottom of the chart. The 1998 crisis drops it below $500. Then begins a long, patient climb: $1,000 by 2005, $2,000 by 2008, $3,700 by 2012. But here is where the line flattens. From 2012 to about 2020, Indonesia's GDP per capita plateaus in the $3,000-$4,000 range — the commodity downturn and rupiah weakness erasing gains in dollar terms. It picks up again after 2020, reaching roughly $4,900 by 2024. Not bad. But not great for a country with ambitions of joining the ranks of upper-middle-income nations by 2030.
The green line is the chart's surprise: Vietnam, which starts nearly at the bottom in 1990, barely above zero, and climbs with remarkable consistency — $100 to $500 to $1,500 to $4,300 by 2024. Vietnam's line crosses Indonesia's around 2023. That crossover is a moment of psychological significance: a country that was poorer than Indonesia for essentially all of modern history is now richer per capita. The orange line — the Philippines — hugs the bottom alongside Vietnam for much of the chart before reaching about $3,900 by 2024, just below Indonesia. The race is tightening.
The commodity story also explains why Indonesia's GDP per capita — and by extension, its Big Mac price — has not grown as fast as its neighbors'. Palm oil and coal generate enormous export revenue, but they employ relatively few people per dollar of output compared to manufacturing. Vietnam, which bet on factories rather than farms and mines, has seen its per capita income converge with Indonesia's. The green line on the chart is a gentle rebuke to the commodity model: you can be rich in resources and still trail a country with almost no natural endowments but superior manufacturing infrastructure.
Commodities, though, are a double-edged sword for currencies. When palm oil and coal prices are high — as they were during the global commodity supercycle of 2004-2011, and again during the post-COVID recovery — dollars flow into Indonesia, the trade surplus swells, and the rupiah strengthens. When prices fall, the opposite happens. The rupiah's journey from 9,000 per dollar in 2011 to over 16,000 in 2025 traces, in large part, the waning of that commodity boom and the tightening of global financial conditions that followed.
The Fed's Long Shadow
There is a force more powerful than any commodity cycle, any trade agreement, or any domestic policy that shapes the rupiah's value: the US Federal Reserve. The Fed does not intend to move the Indonesian rupiah. It does not think about Jakarta when it raises rates. But the rupiah moves anyway, because in a world of free-flowing capital, interest rate differentials are gravity.
The mechanism is straightforward, if brutal. When the Fed raises interest rates, as it did aggressively from March 2022 through mid-2023, US Treasury bonds start offering higher returns. Global investors — pension funds, hedge funds, sovereign wealth funds — shift their money from riskier emerging-market assets into the safety of dollar-denominated bonds. Capital flows out of countries like Indonesia, and their currencies weaken. Economists call it the "carry trade unwind." For Indonesian policymakers, it feels more like a riptide.
Consider the numbers. Between early 2022 and late 2023, the Fed lifted its benchmark rate from near zero to 5.25-5.50%, the fastest tightening cycle in four decades. A US savings account that paid 0.1% in 2021 was suddenly offering 5%. A 10-year Treasury bond yielding 1.5% was now yielding 4.5%. For a global investor managing billions of dollars, the calculus was simple: why take the risk of holding Indonesian government bonds yielding 7% when you could get 5% from the US government with essentially zero default risk? The interest rate differential — the gap between what Indonesia and America paid on their bonds — narrowed, and with it went the financial incentive to keep money in emerging markets. The rupiah fell from around 14,300 to 16,000 per dollar. Bank Indonesia responded by raising its own policy rate from 3.5% to 6.25%, trying to keep Indonesian bonds attractive enough to stem the outflow. It was, in the language of international economics, an illustration of the "impossible trinity": a country cannot simultaneously maintain a fixed exchange rate, free capital movement, and an independent monetary policy. Indonesia, like most emerging markets, chose to let the exchange rate flex and to shadow the Fed's moves at the cost of its own growth preferences.
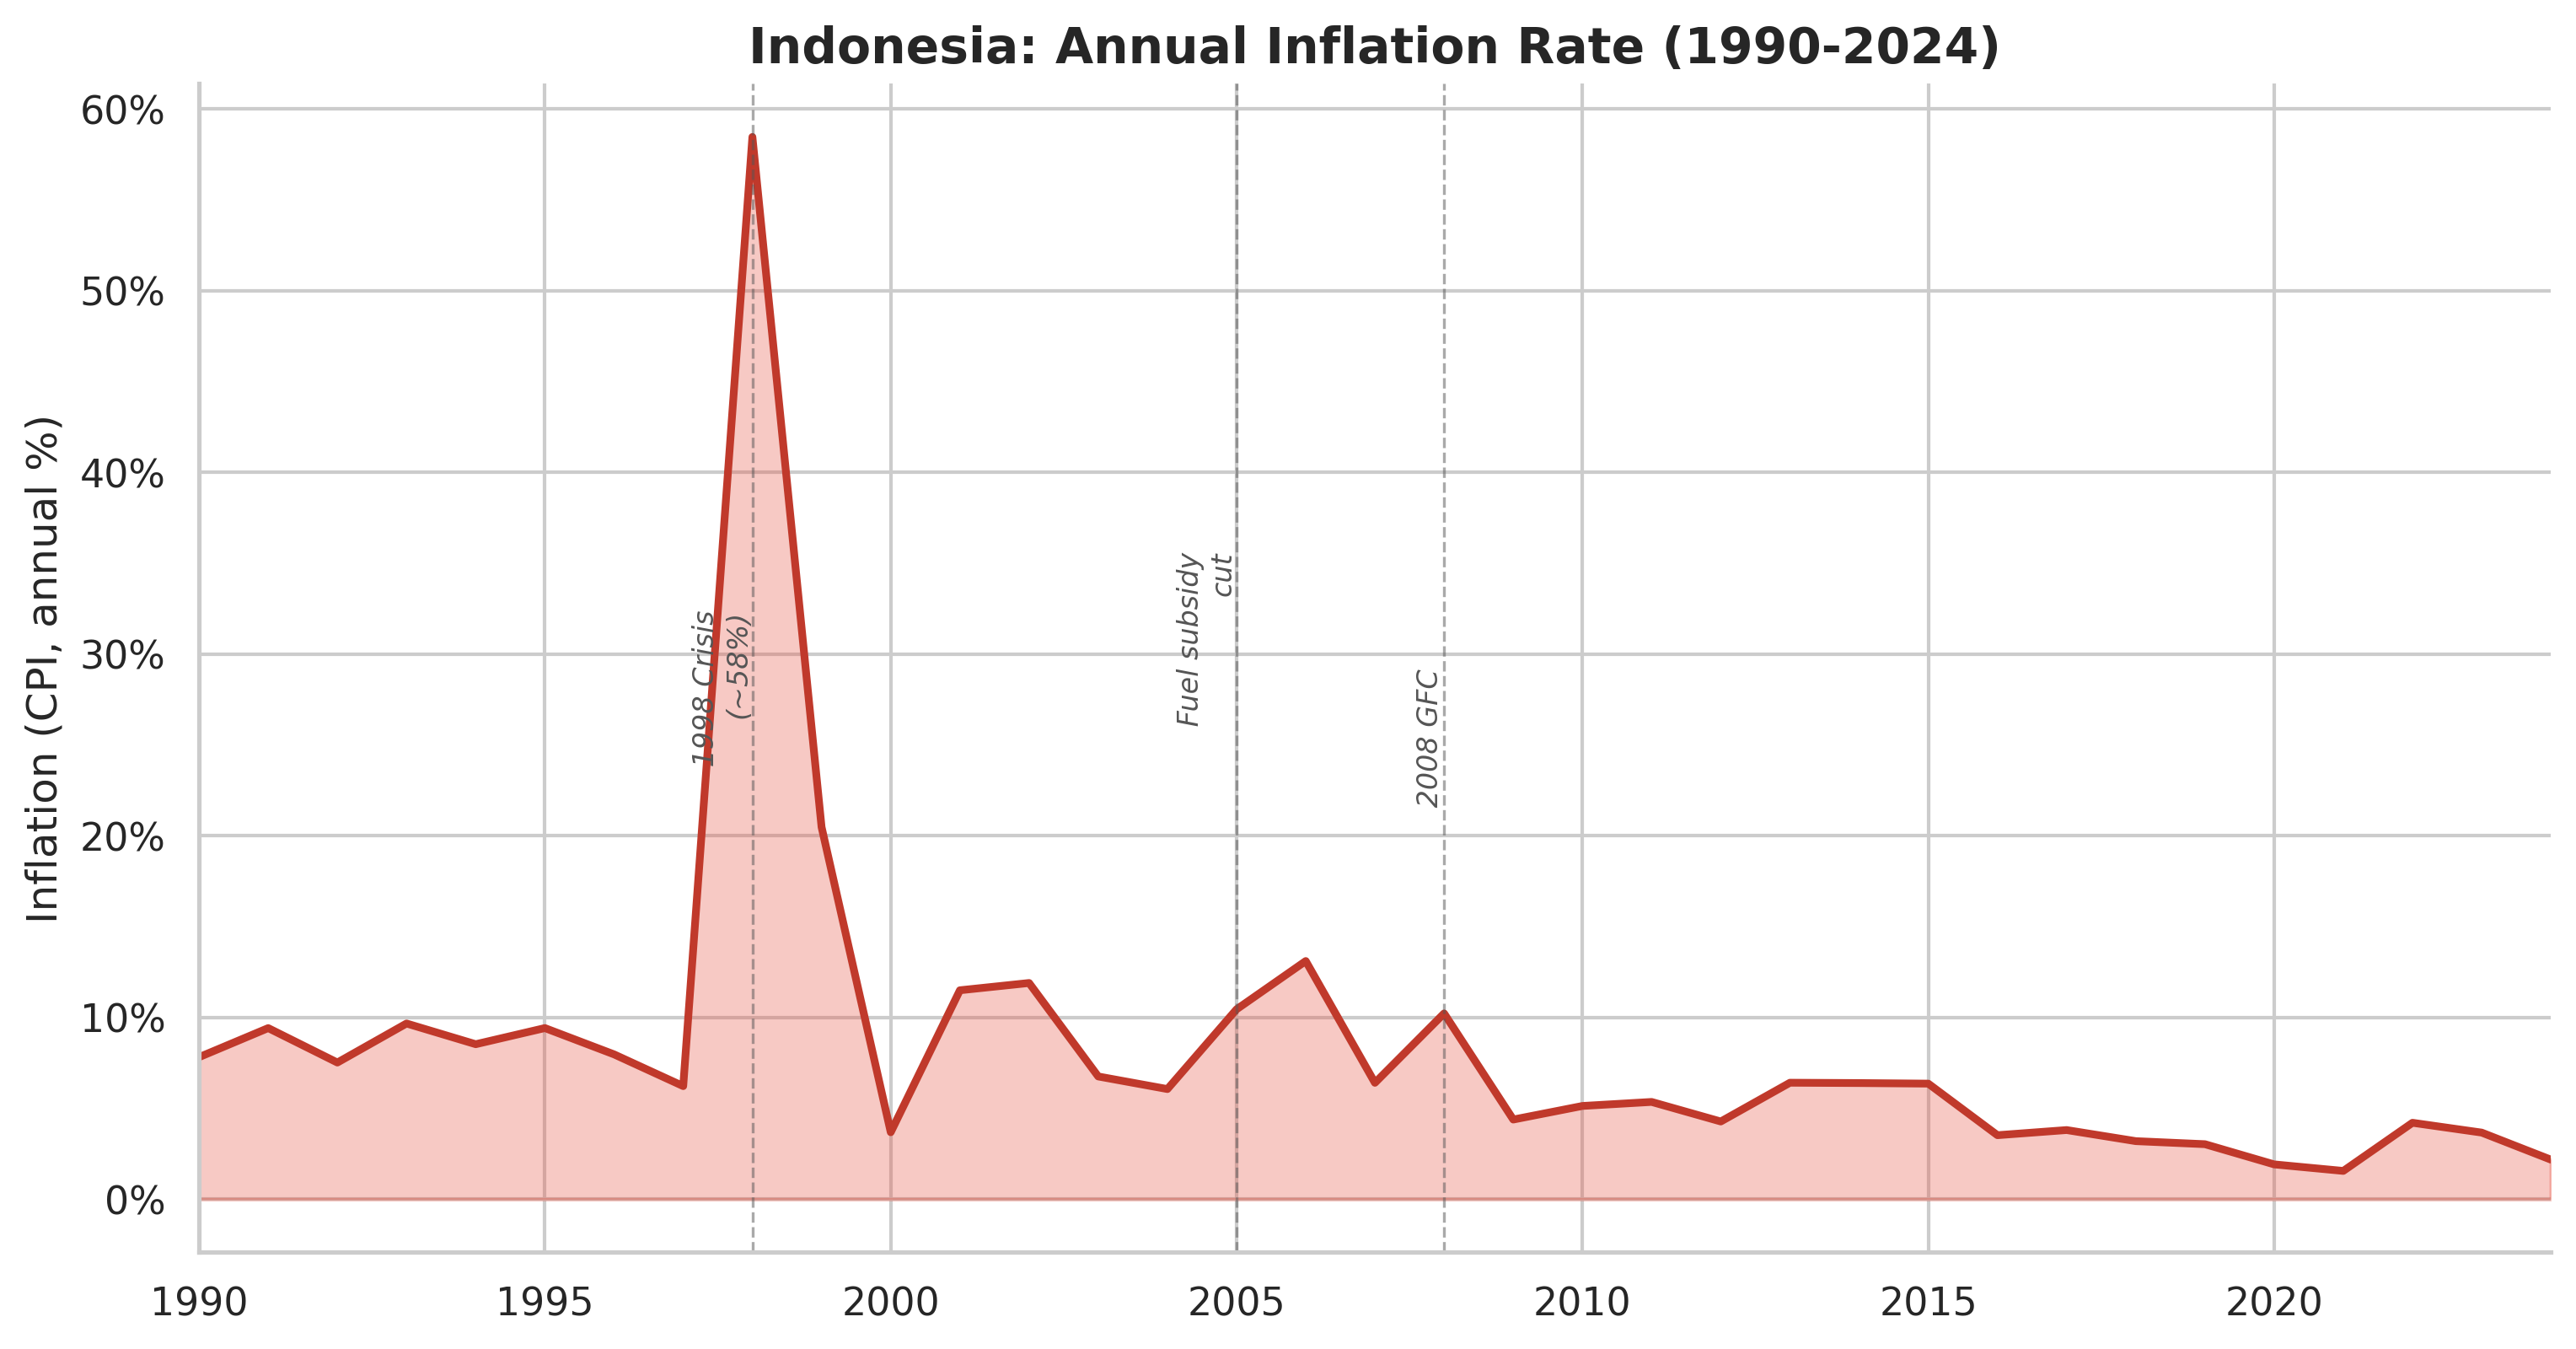
That spike in 1998? Inflation hit 58%. The long, flat line after 2005 is the Bank Indonesia inflation-targeting era — one of the great, quiet successes of Indonesian economic management.
The chart is a study in before and after. On the left side, from 1990 through the mid-1990s, the shaded area oscillates between roughly 7% and 10% — elevated by developed-world standards, but consistent and manageable. Indonesia's Suharto-era economy ran warm, and prices reflected it.
Then comes 1998, and the chart erupts. The line rockets upward to nearly 60%, a vertical spike so dramatic it compresses the rest of the chart into flatness by comparison. That single year — when the rupiah collapsed, imports became ruinously expensive, and the government printed money to bail out banks — produced more inflation than the entire preceding decade combined.
The descent after 1998 is almost as dramatic as the spike. By 2000, inflation is back to around 4%. But the chart shows it didn't stay there. A smaller hump around 2002 (about 12%) and another in 2005-2006 (around 10-13%, driven by fuel subsidy cuts) show the aftershocks of a still-healing economy. The 2008 Global Financial Crisis produces one more visible bump to about 10%.
Then something changes. After 2008, the line settles into what can only be described as a gentle exhalation. It drifts from 6% to 5% to 4% to 3%, with no more spikes, no more panics. By the 2020s, inflation is running between 1.5% and 3% — inside Bank Indonesia's target band and comparable to inflation rates in much wealthier economies. The transformation from a country that experienced 58% inflation in living memory to one that now routinely hits its 2.5% target is one of the great, underappreciated success stories of Indonesian economic governance.
By early 2025, the tightening cycle was over. Bank Indonesia eased its policy rate to 5.75%, and later to 4.75%, as inflation settled within the 2.5% target band. But the episode left a mark: the rupiah's weakness in 2022-2024 — from 14,300 to over 16,000 — showed up directly in the Big Mac Index, pushing Indonesia deeper into "undervalued" territory. The burger didn't get cheaper in rupiah; the rupiah got cheaper in dollars.
There is a direct line between the Federal Reserve's boardroom in Washington and that $2.52 Big Mac in Jakarta. Each 25-basis-point rate hike in the US weakens the rupiah by a few fractions of a percent, which means the dollar price of an Indonesian burger drops by a few cents, which means Indonesia drifts a little further into "undervalued" territory on the Big Mac Index. The index doesn't know the Fed exists. But the Fed is baked into every number.
This is a critical subtlety that the Big Mac Index sometimes obscures. When the index says the rupiah is "58.9% undervalued," it is measuring the gap between the market exchange rate and the PPP exchange rate — the rate at which a Big Mac would cost the same in both countries. But that gap can widen not because Indonesian burgers got cheaper, but because the dollar got stronger. The Fed's decisions in Washington ripple through Jakarta's McDonald's price tags — a reminder that no economy, however large, controls its own currency alone.
The Trump Tariff Shock
If the Fed's interest rate decisions are a slow-moving riptide, the trade war that erupted in 2025 was a rogue wave.
On April 2, 2025 — a date the administration branded "Liberation Day" — the United States imposed a 10% universal tariff on all imports, plus additional "reciprocal" tariffs on countries deemed to have unfair trade practices. Indonesia was hit with a 32% rate initially. Vietnam was hit with 46%. Cambodia, 49%. The announcement triggered a sell-off in Southeast Asian currencies and stock markets.
For context: Indonesia's total merchandise exports to the United States in 2024 were worth roughly $25 billion. A 32% tariff threatened to cut a significant slice of that overnight, affecting everything from sneakers to shrimp. The Jakarta stock exchange dropped 3% in a single session on the day of the announcement. The rupiah wobbled. Bank Indonesia intervened in currency markets to stabilize the selloff.
The negotiations that followed were, by many accounts, lopsided. Indonesia's tariff rate was eventually reduced to 19-20% — roughly in line with Thailand, Malaysia, and the Philippines. In exchange, Jakarta agreed to eliminate 99% of tariff barriers for US goods, purchase $15 billion in American oil and gas, $4.5 billion in US "cultural products," and approximately $3.2 billion in aircraft. Indonesian officials celebrated the deal. Not everyone was convinced.
The irony, six months later, was striking. US trade with Southeast Asia actually rose in 2025, even as tariff rates remained elevated. The reason was a deeper structural shift: ASEAN countries were increasingly importing Chinese components and intermediate goods, adding marginal value, and re-exporting finished products to the US. The tariff wall, in other words, was not stopping trade so much as rerouting it — with Southeast Asia serving as the connector between Chinese manufacturing and American consumption.
For the rupiah, the tariff shock added another layer of uncertainty to an already nervous currency. Indonesia's textile and electronics sectors — which accounted for $4.83 billion and $2.64 billion in exports to the US in 2024, respectively — faced real demand destruction. The garment industry, already in decline, braced for further contraction. But the nickel strategy provided a partial hedge: critical minerals, essential for America's own EV ambitions, were largely spared from the worst tariff treatment. Indonesia, it turned out, had built leverage that most of its neighbors lacked.
President Prabowo Subianto, who took office in October 2024, responded to the turbulence with a blend of ambition and pragmatism. He launched Danantara, a state-owned investment vehicle pooling 47 state-owned enterprises under a single holding company with an initial fund of $20 billion. He set an audacious target of 8% annual GDP growth by 2029 — well above the 5% corridor Indonesia had occupied for a decade. He pledged free nutritious meals for school children and pregnant women. And he continued, with adjustments, his predecessor Jokowi's pet project: the construction of Nusantara, a new capital city on Borneo budgeted at 48.8 trillion rupiah for its second phase — even though the project was conspicuously absent from Prabowo's own list of top-five strategic priorities.
The World Bank, the IMF, and the Asian Development Bank all projected Indonesian growth of around 5% in 2025 — solid by any standard, but a long way from 8%. The gap between ambition and arithmetic tells its own story about where Indonesia stands. Five percent growth is enviable by the standards of most major economies. But for a country that needs to create roughly 2 million new jobs every year just to absorb its young population, 5% feels like running in place. To reach 8%, Indonesia would need to attract vastly more investment, cut bureaucratic red tape that still chokes new business formation, and modernize an education system that ranks in the bottom third of OECD assessments. Prabowo has three years left in his first term to close that gap. The Big Mac Index, updated every six months, will be one of many scoreboards.
What the Burger Really Tells You
So what does that $2.52 Big Mac actually reveal? And how should you think about it — not as an economist scanning a data table, but as a human being trying to understand what it means for 284 million people?
Start with the raw number. In January 2026, the market exchange rate averaged about 16,807 rupiah per dollar. A Big Mac in Jakarta cost approximately 42,000 rupiah. Convert that at the market rate, and you get $2.52. The same burger in the US cost $6.12. The "implied PPP rate" — the exchange rate at which the burgers would cost the same — is about 6,863 rupiah per dollar (42,000 / $6.12). Since the actual market rate (16,807) is far weaker than the PPP rate (6,863), the Big Mac Index declares the rupiah 58.9% undervalued.
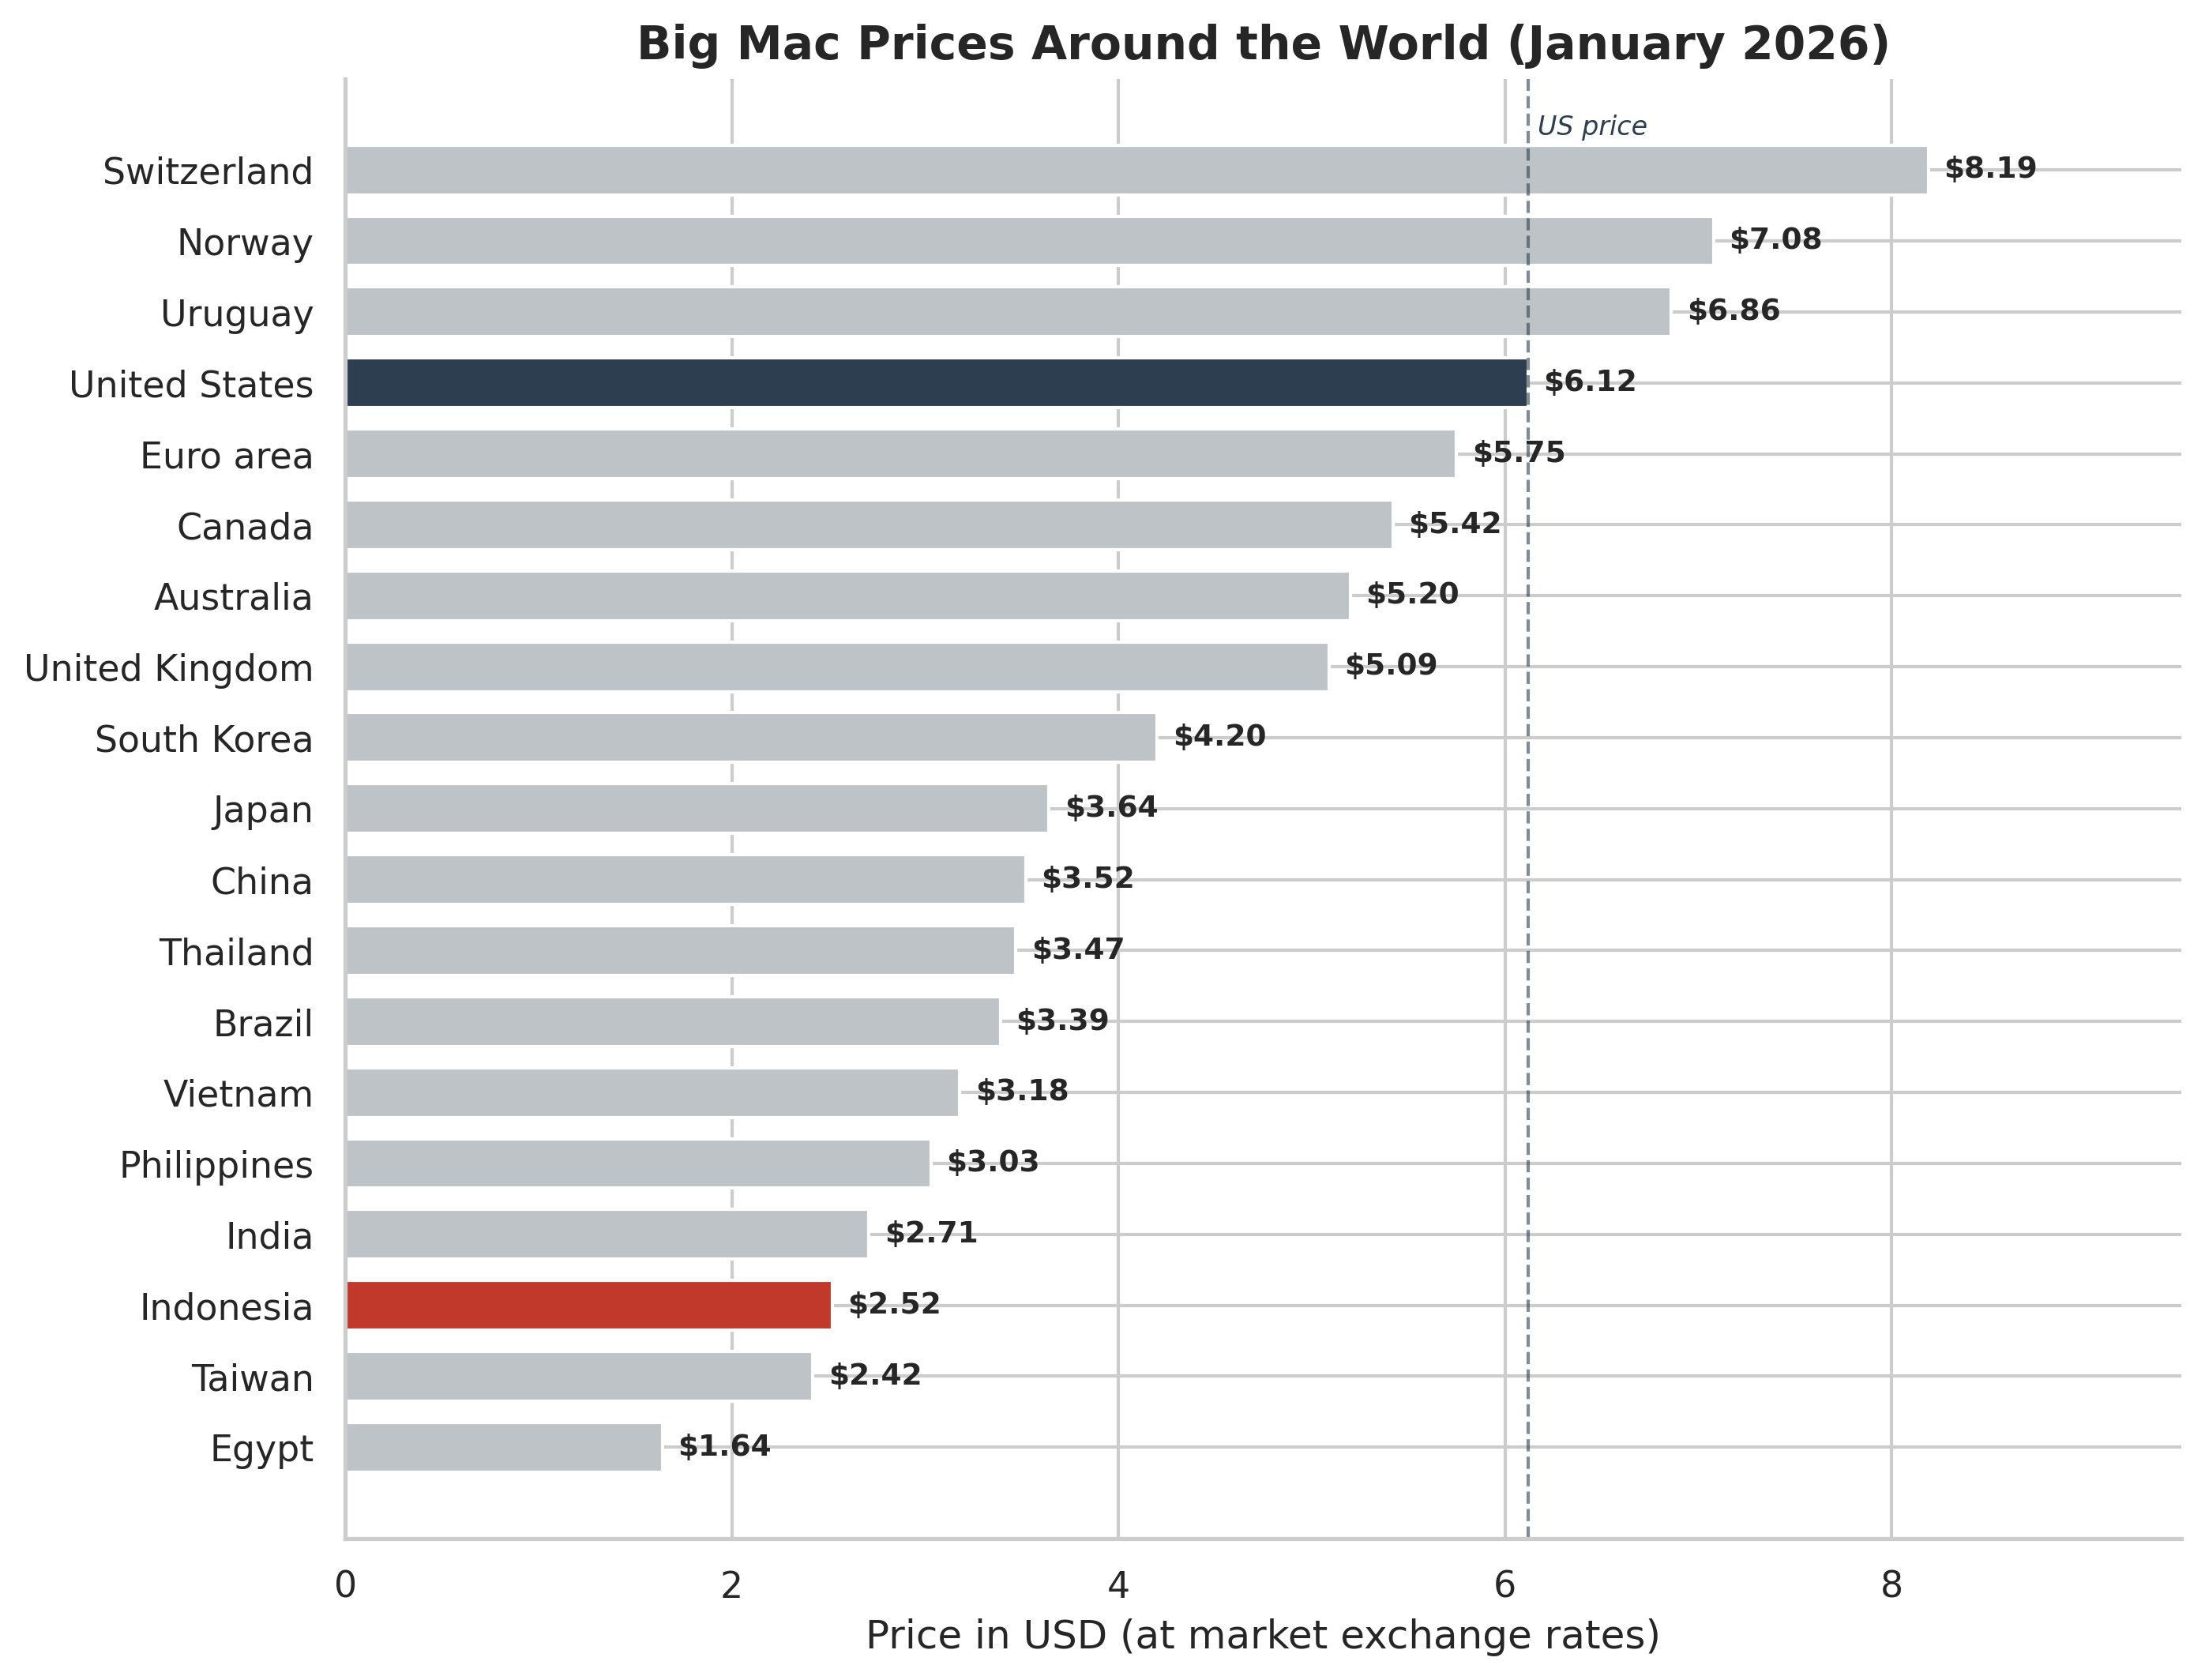
Indonesia's $2.52 burger puts it near the bottom of the global rankings. Switzerland, at $8.19, is a different planet.
The bar chart arranges 19 countries from cheapest to most expensive, and the visual impact is immediate. At the top, Switzerland's bar stretches all the way to $8.19 — the longest bar on the chart, more than three times the length of Indonesia's. Norway follows at $7.08, then Uruguay at $6.86. The United States, highlighted in dark charcoal, sits at $6.12 with a dashed vertical reference line marking its position — a kind of equator dividing the expensive world from the cheap one.
Below the US line, the bars shorten rapidly. The Euro area, Canada, Australia, and the UK all cluster in the $5.00-$5.75 range. South Korea at $4.20 begins the transition to the developing world. Japan at $3.64 — a wealthy country whose currency has weakened dramatically — sits surprisingly close to China ($3.52) and Thailand ($3.47).
Indonesia's bar, highlighted in red near the bottom, stops at $2.52. Only Taiwan ($2.42) and Egypt ($1.64) are cheaper. India, at $2.71, is just slightly above Indonesia. The visual tells the story instantly: Indonesia's burger is less than a third the price of Switzerland's, less than half the US price. The dashed US reference line looms over the bottom third of the chart like a ceiling that most of the developing world has yet to reach.
Now apply the GDP adjustment. The Economist's adjusted index accounts for the fact that poorer countries are systematically cheaper — a phenomenon economists call the Balassa-Samuelson effect. The logic is intuitive: in a country where wages are lower, services are cheaper, and therefore the prices of goods with a large labor component (like a restaurant burger) will be lower too. This is not a market failure. It is how the world works. The GDP-adjusted index asks: given Indonesia's income level, how much cheaper should a Big Mac be? The answer, according to The Economist's January 2026 data, is about 23.9% less than in the US. But the actual price is 58.9% less. The remaining gap — 45.9% — is the "adjusted undervaluation."
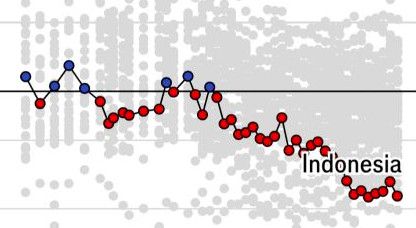
The red dots tracing Indonesia's path over 25 years. From hovering near zero in the early 2000s — neither overvalued nor undervalued — to sinking steadily deeper into undervaluation territory. (The Economist data)
Look at the trajectory in the 2000-2026 trend chart. In the early 2000s, Indonesia's GDP-adjusted Big Mac Index reading hovered near zero — meaning the burger's price was roughly consistent with what you'd expect given the country's income level. From about 2013 onward, the dots start drifting downward, deeper into undervaluation. By 2020, they've settled around -40 to -50%. Today, at -45.9%, Indonesia is further from "fair value" than at almost any point in the index's history.
What drove that drift? The answer is the confluence of forces this essay has already traced: the commodity downturn after 2011, the Fed's tightening cycles pulling capital out of emerging markets, the rupiah's steady weakening from 9,000 to 16,000 per dollar. Indonesian Big Mac prices in rupiah didn't fall — they actually rose, reflecting domestic inflation. But the exchange rate fell faster, making those prices look cheaper and cheaper in dollar terms.
The Big Mac Index has well-known limitations, of course. McDonald's adjusts prices strategically in different markets, sometimes keeping them artificially low to attract customers in price-sensitive countries. Local taxes, import duties, and supply chains vary. Indonesia, with its halal requirements for beef and distinct sourcing for ingredients, faces cost structures that don't perfectly map onto the American supply chain. The index also cannot capture the vast informal food economy that feeds most Indonesians: the $0.70 plate of nasi goreng from a street cart, the $0.50 bowl of bakso from a pushcart vendor. A Big Mac, at $2.52, is actually aspirational eating for many — a treat, not a staple.
There is a deeper limitation, too. The Big Mac Index treats every country as if it were a single market with a single price. But Indonesia stretches across three time zones, from the urban density of Java — where 150 million people live on an island the size of Alabama — to the remote highlands of Papua, where some communities are still accessible only by bush plane. The price of a Big Mac in a Jakarta mall and the price of a Big Mac in a Surabaya food court may differ. The price of anything in Papua is distorted by logistical costs that make the island's remoteness a tax on daily life. A national "Big Mac price" for a country this diverse is, at best, an approximation.
But the index's power lies not in its precision but in its accessibility. It makes visible something that economic data tables cannot: the lived experience of purchasing power across borders. An American tourist in Bali feels the rupiah's undervaluation every time she buys a $3 seafood dinner that would cost $40 in San Francisco. An Indonesian student studying in Sydney feels it in reverse — every tuition payment, every month of rent, is a small act of currency punishment.
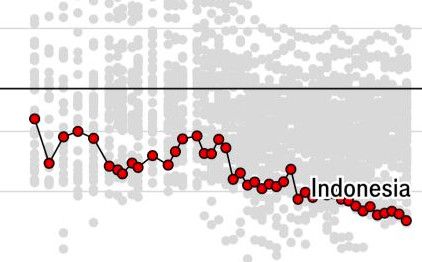
The raw index tells a starker story: Indonesia has been "undervalued" on the Big Mac yardstick for virtually the entire 21st century. (The Economist data)
Indonesia's Current Account: The Trade Story
Exchange rates, in the end, are prices — and prices are set by supply and demand. The demand for rupiah depends, at the most fundamental level, on whether the world wants to buy Indonesian goods and invest in Indonesian assets. The supply of rupiah depends on whether Indonesians want to buy foreign goods and invest abroad. The balance between these forces shows up in a single number: the current account.
The current account is the broadest measure of Indonesia's economic relationship with the rest of the world — how much it earns from exports, tourism, and investment income versus how much it spends on imports, foreign travel, and payments to foreign investors. When the current account is in surplus, more dollars are flowing into Indonesia than out, and the rupiah tends to be stable or strengthening. When it's in deficit, the country depends on foreign capital inflows — hot money, portfolio investment, FDI — to fill the gap. If those inflows stop, the rupiah falls. This is what happened in 1998, in 2013, and to a lesser degree in 2022.
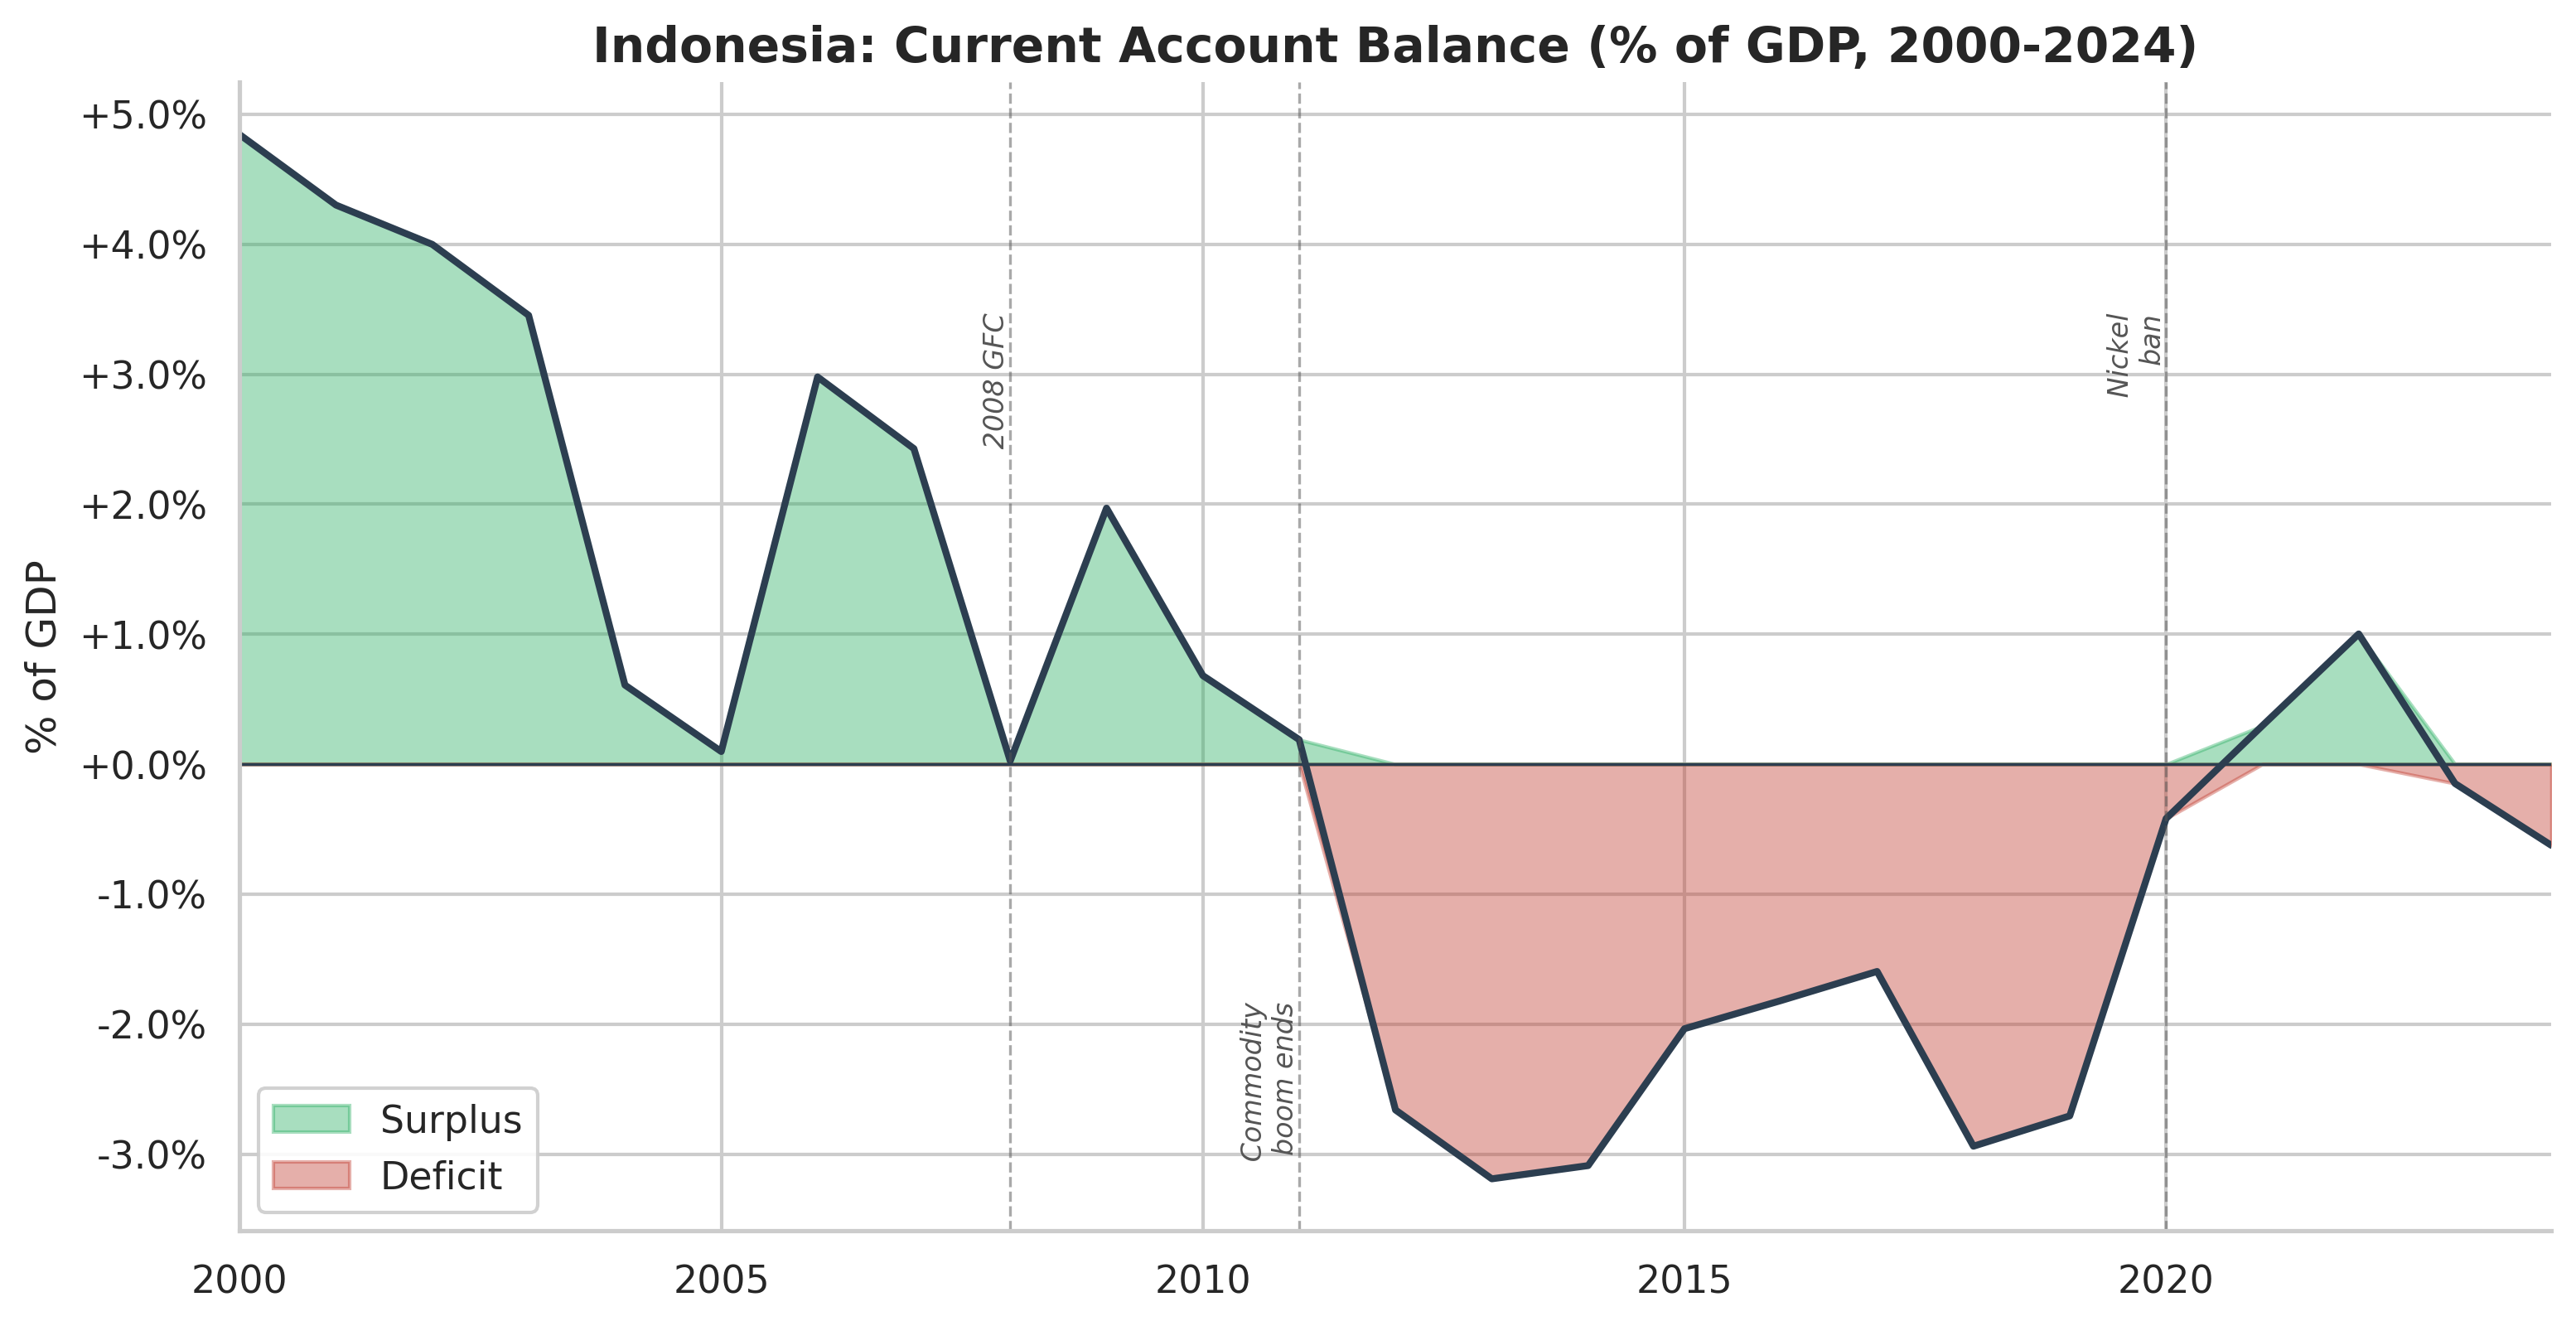
The swings from surplus to deficit track Indonesia's commodity fortunes — and its vulnerability to shifts in global demand.
The chart splits into two colors — green for surplus, red for deficit — and the visual effect is striking. In 2000, the green shading rises to nearly +5% of GDP, a legacy of the post-crisis export boom when a weak rupiah made Indonesian goods extraordinarily competitive. But the green shrinks year by year through the early 2000s, narrowing from +5% to +3% to about +1% by 2008. The commodity supercycle of the mid-2000s produces a visible widening around 2006-2007 — back to about +2.5% — before the Global Financial Crisis briefly collapses it.
Then comes the pivot. Around 2011-2012, the shading changes from green to red. The current account tips into deficit, and the red zone deepens to nearly -3.5% of GDP by 2013-2014. This is the era of the "twin deficit" anxiety, when policymakers worried that Indonesia's combination of budget deficits and current account deficits made it vulnerable to the kind of sudden stop in capital flows that destroyed the economy in 1998. The rupiah's weakness during the 2013 taper tantrum was directly connected to this red patch on the chart.
What follows is a slow recovery. The deficit narrows, oscillating between -0.5% and -3% through the late 2010s. Then, around 2020 — marked by the "Nickel ban" annotation — the balance swings back toward green. The nickel export ban and the COVID-era commodity price surge produce a brief surplus around 2021-2022 of about +1%. But by 2024, the line has drifted back toward slight deficit. The chart's overall trajectory — from deep surplus to deep deficit to tentative balance — mirrors Indonesia's journey from crisis-era exporter to increasingly import-dependent emerging market trying to find equilibrium.
Indonesia's current account balance — the broadest measure of its trade and income flows with the rest of the world — tells a story of feast and famine. During the commodity supercycle of the mid-2000s, when palm oil, coal, and rubber prices were surging, Indonesia ran comfortable surpluses. After 2011, as commodity prices weakened and import demand for capital goods grew, the current account swung into deficit — a structural vulnerability that made the rupiah more sensitive to capital outflows. The nickel ban in 2020 helped stabilize the trade picture by boosting export value, but the current account remains a swing factor, tightly linked to global commodity prices that Indonesia influences but does not control.
The Regional Race
Indonesia's Big Mac undervaluation doesn't exist in a vacuum. Its ASEAN neighbors tell their own currency stories, and the comparison is revealing.
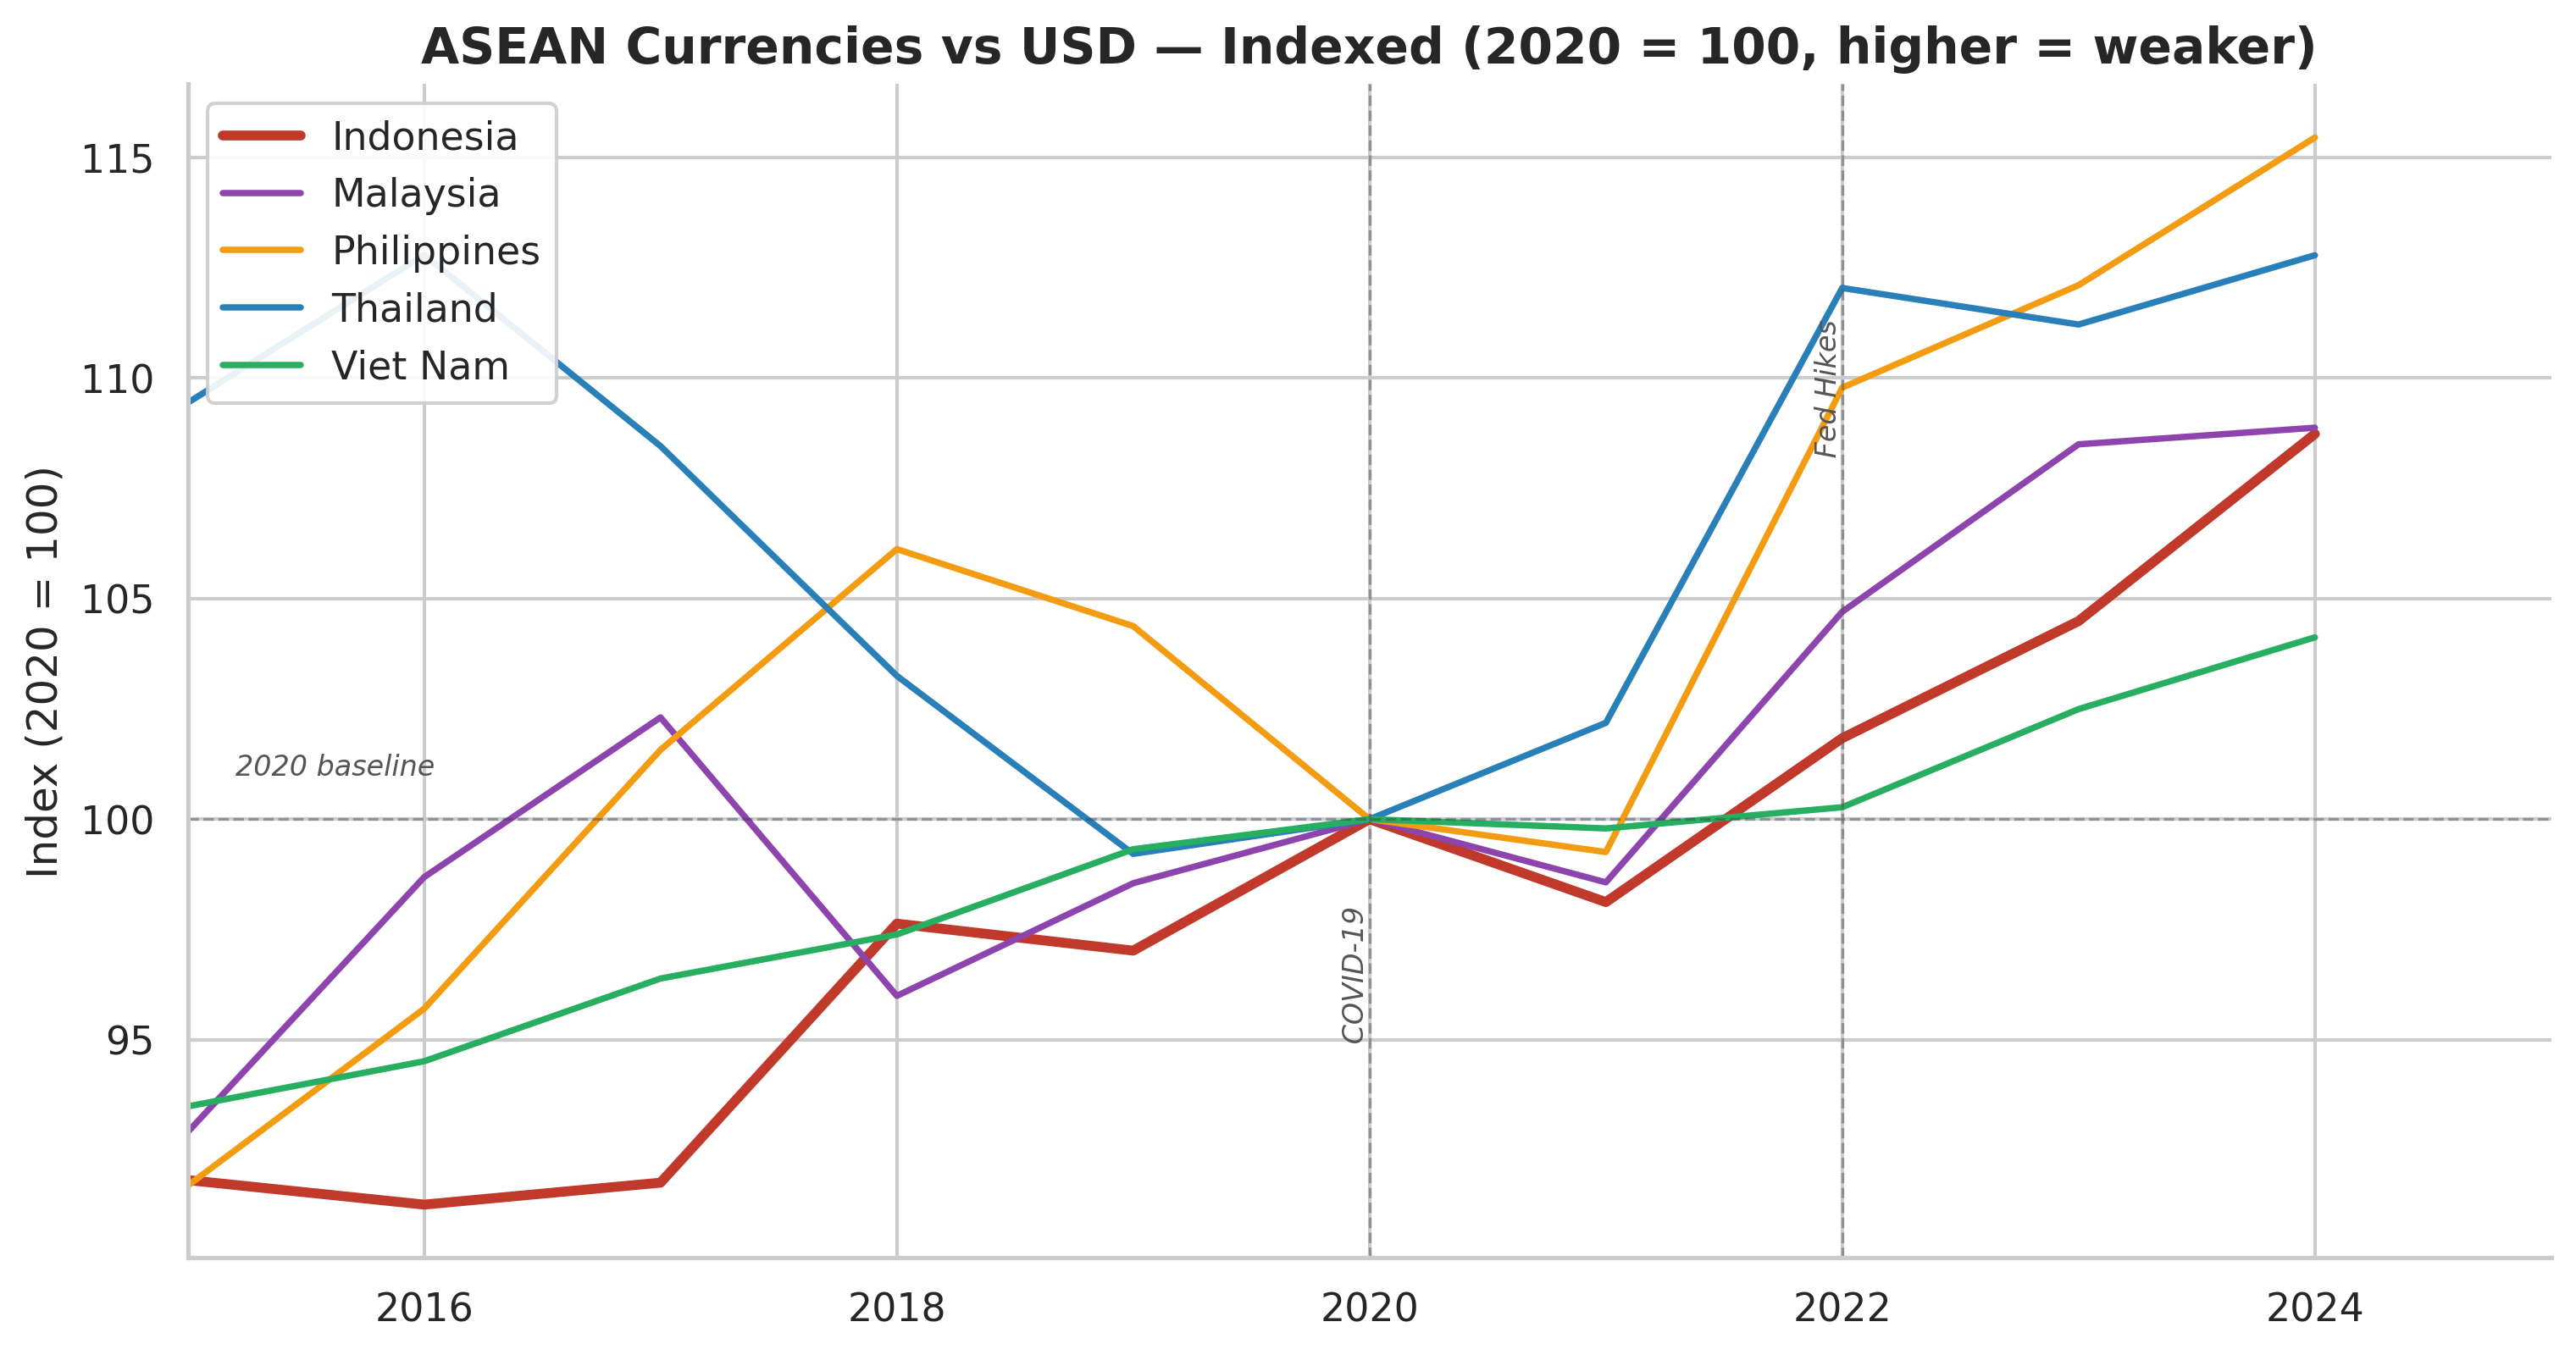
All five currencies weakened against the dollar after 2020. Indonesia's rupiah — the red line — was among the most affected.
The chart indexes each currency to 100 at its 2020 value, with higher numbers meaning a weaker currency. Start at 2020, where all five lines converge at 100 — the baseline. What happens next is a synchronized upward drift: all five currencies weaken against the dollar. But the speeds diverge.
The blue line — Thailand — is the chart's most dramatic mover. It shoots from 100 to about 115 by 2024, making the baht one of the weakest performers in the region. The red line — Indonesia — climbs steadily to around 110 by 2024, a clear weakening but less severe than Thailand's. The purple line — Malaysia — shows an interesting pattern: it was already above 100 before 2020 (the ringgit had been weakening since 2015), dipped to 100 at the baseline, then rose to about 110 alongside Indonesia.
The orange line — the Philippines — is the chart's most volatile. It spikes to around 105 by 2016, then falls back, then rises again after 2022 to about 110. The green line — Vietnam — is the steadiest of the group, staying relatively flat from 2015 through 2020 and only rising modestly to about 104 by 2024. Vietnam's managed peg keeps the dong more stable, though at the cost of foreign reserves.
The overall picture is one of synchronized weakness but uneven pain. Every ASEAN currency lost ground to the dollar after the Fed began tightening in 2022. Indonesia's rupiah — the red line — sits in the middle of the pack: more affected than Vietnam and Malaysia, less affected than Thailand and the Philippines. The chart makes visible what the Big Mac Index measures by other means: the dollar's gravitational pull on the entire region.
Since 2020, every major ASEAN currency has weakened against the dollar, buffeted by the same forces: COVID-19 stimulus creating a wall of dollars, followed by the Fed's aggressive tightening pulling that liquidity back. The Indonesian rupiah, the Thai baht, the Philippine peso, the Malaysian ringgit, and the Vietnamese dong all depreciated — but at different speeds and to different degrees. Malaysia, with its oil wealth and current account surpluses, held up better. Vietnam, despite its massive export sector, saw the dong weaken as the Fed's rate advantage widened. Indonesia sat somewhere in the middle — stronger than the Philippines, weaker than Malaysia — reflecting its mixed fundamentals: large and growing, commodity-rich but import-dependent, reformed but still developing.
What the chart really reveals is that the Big Mac's undervaluation is not a uniquely Indonesian phenomenon. It is a regional condition, driven by a common cause: the overwhelming dominance of the US dollar in global finance. When the Fed tightens, all of Southeast Asia gets cheaper in dollar terms. When it eases, the region gets more expensive. Indonesia's individual story — its commodities, its crisis history, its policy choices — matters, but it plays out against a backdrop of dollar hegemony that affects every country in the chart.
The GDP per capita comparison puts Indonesia's position in sharper relief. At around $4,900 per person in 2024, Indonesia sits above the Philippines but below Vietnam, Thailand, and Malaysia. It is the fourth-largest economy in the world by population, the largest in Southeast Asia by total GDP — and yet, per person, it ranks in the bottom half of its regional peer group. This is the paradox at the heart of Indonesia's economic identity: enormous aggregate weight, modest individual prosperity. The Big Mac Index captures this perfectly. Indonesia's economy is huge. Its burgers are cheap.
The Long Game
What happens next? The question is not rhetorical. Indonesia is at an inflection point — too large to ignore, too complex to categorize, and too dynamic to predict with any confidence.
Start with what the country has going for it. Indonesia possesses something that most of its middle-income peers would trade almost anything for: demographics. The country's 284 million people have a median age of about 30. Its working-age population is still growing. Its middle class — defined by the World Bank as those spending $3.20 to $11 per day — has expanded from under 10% of the population in the early 2000s to nearly 25% today. Every year, millions of Indonesians cross that threshold, buying their first motorcycle, their first smartphone, their first Big Mac.
The nickel strategy is part of a broader bet on what economists call "moving up the value chain." Instead of exporting raw materials and importing finished goods — the classic middle-income trap — Indonesia is trying to capture more of the value-added steps: smelting, refining, battery manufacturing, and eventually, perhaps, assembling the electric vehicles themselves. Prabowo's Danantara, the $20 billion sovereign investment fund, is the latest institutional expression of that ambition.
The food security dimension adds another layer. Indonesia is the world's largest importer of wheat and a major importer of rice in bad harvest years. Prabowo's free school meals program — targeting 82 million students and pregnant women — requires enormous quantities of eggs, milk, fish, and vegetables that Indonesia's fragmented agricultural sector struggles to supply consistently. When the government banned palm oil exports in 2022 to tame cooking oil prices at home, it temporarily sent global edible oil markets into a frenzy. The interconnection between Indonesia's domestic food policies and global commodity markets means that the country's fight against inflation — which has been so successful since 2005 — will face new tests as the government tries to feed more of its population through state programs.
But ambition is not destiny. Indonesia's infrastructure remains a bottleneck. Its education system produces workers faster than its industries can absorb them. Corruption, while improved since the Suharto era, remains a persistent drag on investment. And the external environment — Trump's tariffs, the Fed's rate decisions, China's economic slowdown — is beyond Jakarta's control. The OECD's 2024 survey of Indonesia praised the country's resilience but flagged the familiar list of reforms needed: labor market flexibility, education quality, regulatory simplification, and deeper capital markets.
Indonesia will not be cheap forever. If its economy continues growing at 5% and its inflation stays tamed, its per-capita income will roughly double by the late 2030s. That means wages will rise, services will cost more, and Big Macs in Jakarta will creep closer to the global average. The gap between $2.52 and $6.12 will narrow — slowly, unevenly, but persistently. The Big Mac Index is, in this sense, less a snapshot and more a long-exposure photograph: it captures not just where Indonesia is, but the direction and speed of its movement.
The Big Mac Index, for all its whimsy, captures a real and important truth about Indonesia's moment. The rupiah's persistent "undervaluation" is not a signal that the market is wrong. It is a reflection of the country's position in the global economy: large but still developing, resource-rich but structurally vulnerable, growing steadily but not yet rich enough for its burgers to cost what they cost in New York or Zurich.
There is also the question of where Indonesia fits in the new geopolitical order. The country has long practiced what its diplomats call bebas aktif — "free and active" foreign policy, aligning fully with neither Washington nor Beijing. In the context of the US-China trade war, this stance has been an asset. Indonesia trades heavily with both superpowers and has avoided being pulled into the orbit of either. Its nickel leverage gives it a card to play with Western EV manufacturers who need Indonesian metals for their batteries. Its membership in RCEP — the Regional Comprehensive Economic Partnership — gives it preferential access to markets across Asia. And its sheer demographic scale — more people than Germany, France, the UK, and Italy combined — makes it a prize that both great powers want to court rather than punish.
And perhaps that is the most honest reading of the $2.52 burger. It is not evidence of a broken exchange rate. It is a photograph of a country in motion — moving forward, still climbing, carrying 284 million people across one of the most consequential economic transitions of the 21st century. The teenager in the Jakarta McDonald's doesn't think about purchasing power parity when she orders her Big Mac. She thinks about whether she can afford fries. But her burger, priced in a currency that has survived a 1998 collapse, a global pandemic, and a trade war, tells a story that stretches far beyond the sesame-seed bun. In 1986, when Pam Woodall first published the Big Mac Index, Indonesia didn't even have enough McDonald's locations to be included. The first Indonesian McDonald's opened in 1991, in a country that was still a decade away from democracy and two decades away from joining the G20. Today, Indonesia is in the index, in the G20, and in the conversation about which economies will shape the 21st century. The $2.52 burger is not evidence of failure. It is a timestamp on a transformation that is still underway.
The rupiah is not undervalued. It is still becoming.