The Complexity Trap: Why Civilizations Collapse and How to Avoid the Reset
In the autumn of 2200 BCE, the winds over northern Mesopotamia began to carry more dust than rain. The Akkadian Empire—the world’s first multi-ethnic superpower—stood at the height of its administrative brilliance. Its kings had unified warring city-states, standardized weights, and built a bureaucracy that tracked every bushel of grain from the Fertile Crescent. But as soil sediments at Tel Leilan now reveal, a multi-decade megadrought was about to collide with a system too rigid to adapt. The Akkadians had not just run out of water; they had run out of the social and economic margin required to survive the "Five Horsemen" of collapse: population movement, disease, state failure, trade collapse, and climate change.
These five forces rarely ride alone. The Akkadian drought triggered a famine that drove mass migration from the northern plains into the already-strained southern cities. Famine-stricken migrants overwhelmed local governance. Trade routes that depended on surplus grain withered. Disease followed malnutrition. Within two generations, the most sophisticated state on Earth had fractured into warring city-states, its centralized bureaucracy a memory etched in abandoned clay tablets. This pattern of systemic failure would repeat, with eerie precision, across millennia and continents.
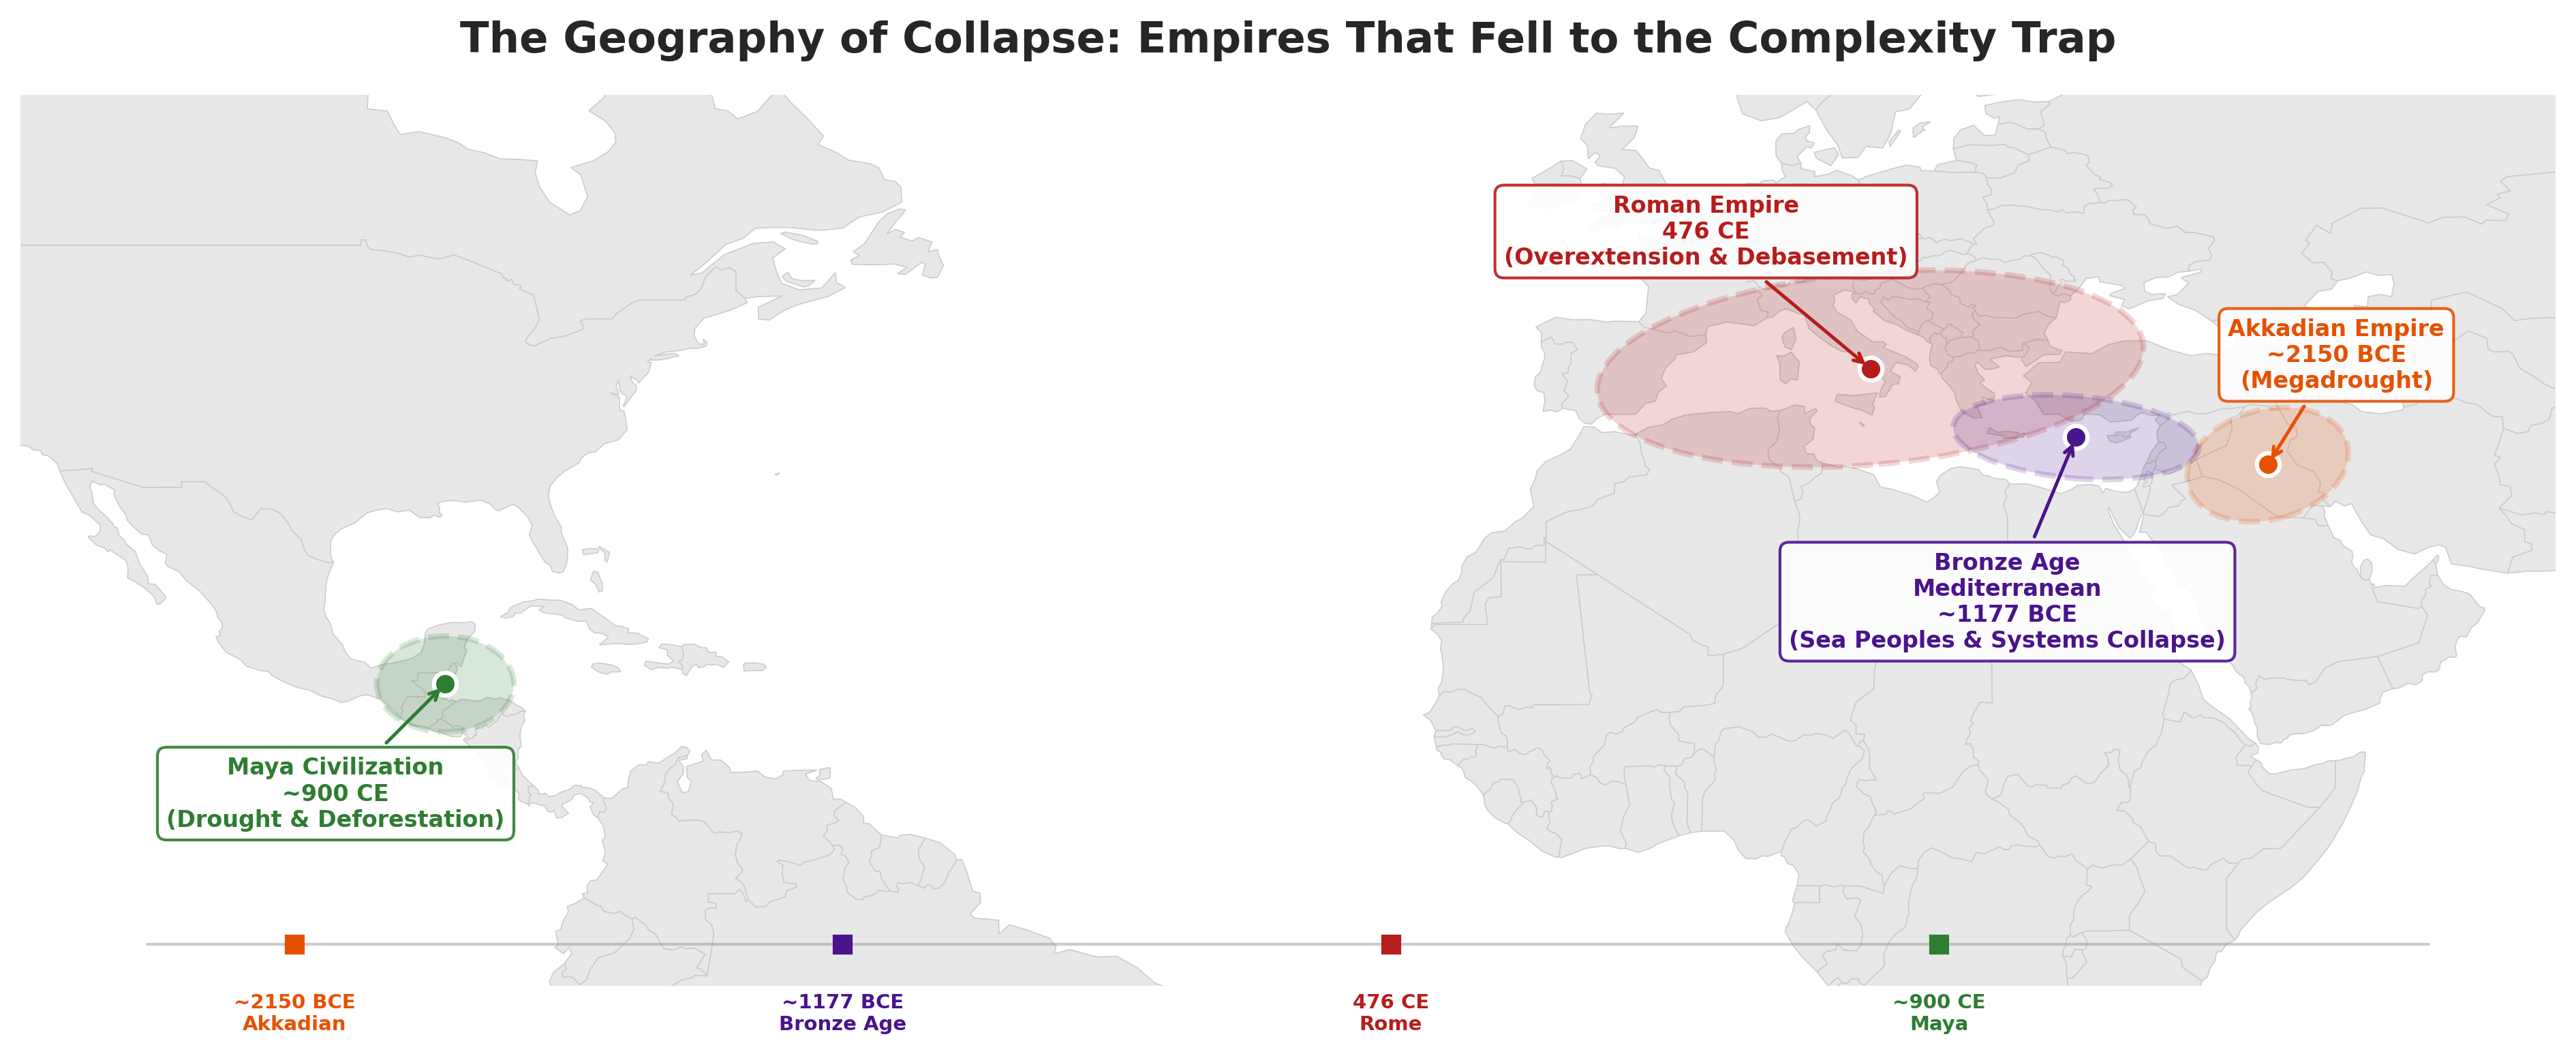
Four empires, four collapses, one recurring pattern. The shaded regions trace the approximate reach of civilizations that fell to the Complexity Trap, from the rain-dependent plains of Akkad to the fragile limestone aquifers of the Maya and the overextended borders of Rome.
The Trap: Complexity as Both Cure and Disease
We often view history as a steady ladder of progress, yet the archaeological record suggests it is more like a series of jagged resets. From the Bronze Age collapse to the fall of Rome, civilizations follow a predictable, tragic arc. They solve problems by increasing complexity—adding layers of government, specialized labor, and longer supply chains—until the cost of maintaining that complexity exceeds the benefits. This spiral of diminishing returns is the "Complexity Trap" (Tainter, 1988), and it has never been more relevant than in our hyper-connected Information Age.
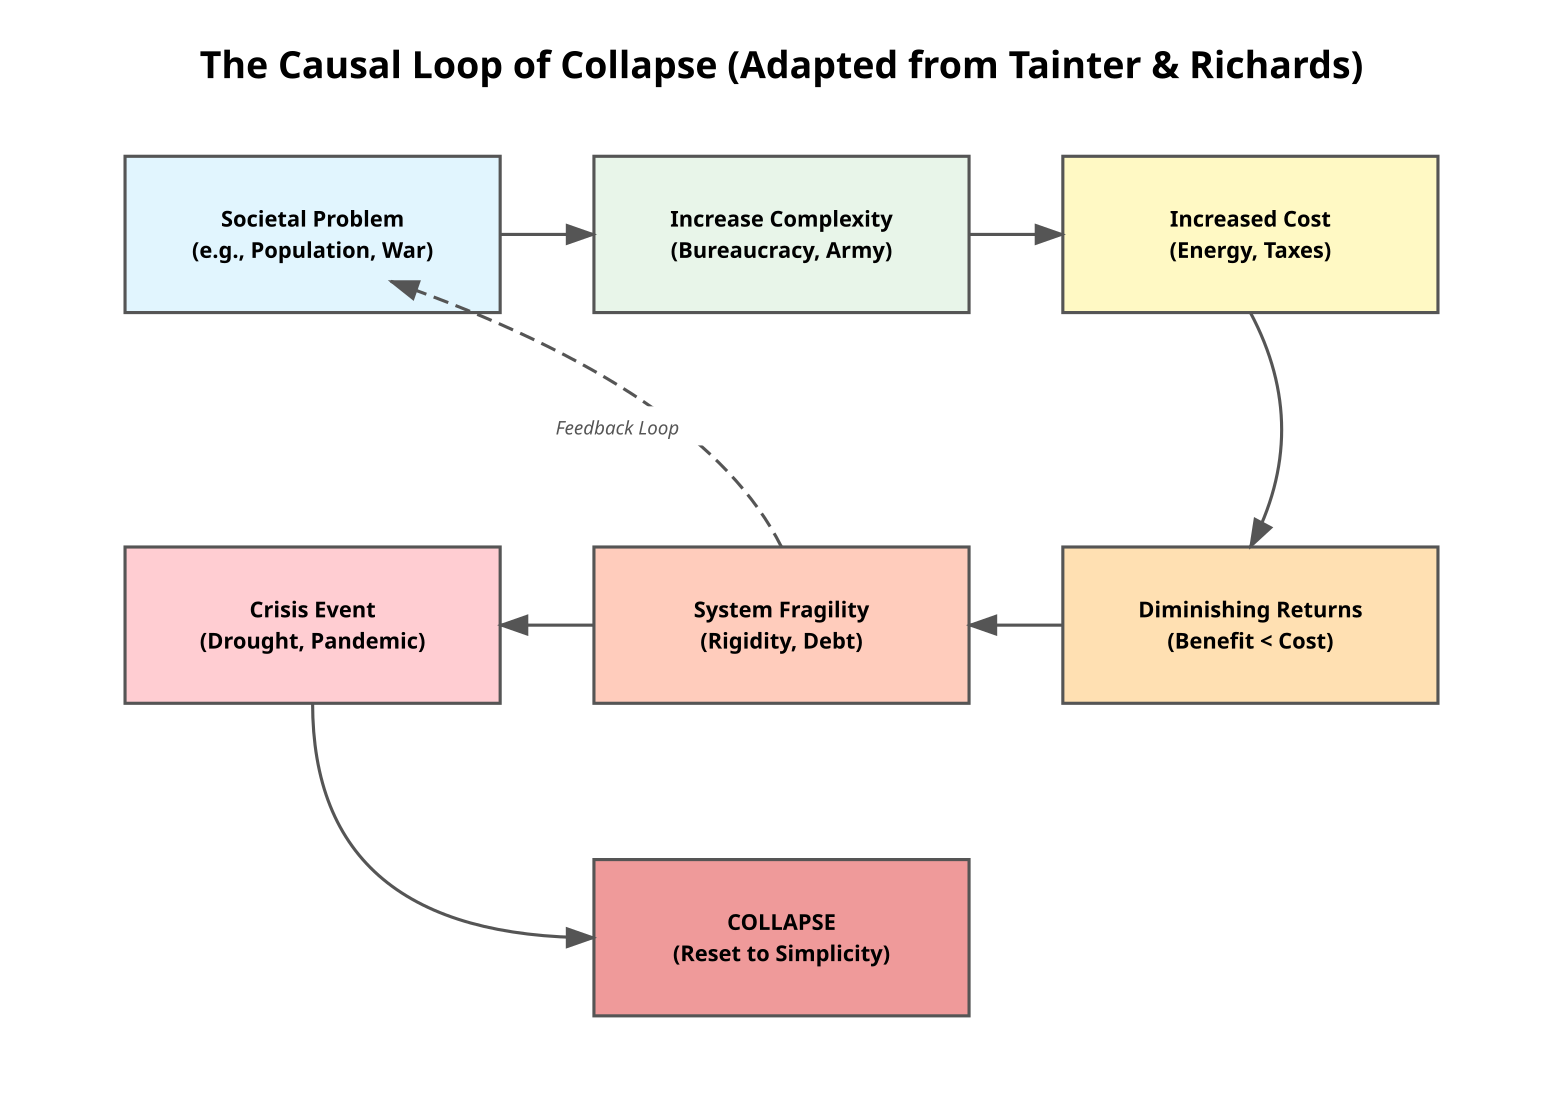
A systemic view of the end. Problems demand complexity, complexity demands resources, and resources eventually hit the law of diminishing returns. Once the system becomes fragile, even a minor crisis can trigger a cascading reset.
The flowchart above provides a visual map of this systemic failure. Start at the top left with the "Societal Problem"—perhaps a growing population or an external military threat. We naturally respond by expanding the bureaucracy or the standing army to "Increase Complexity." But complexity is not free. Every new layer of government demands an "Increased Cost" in energy and taxes, moving the system toward the orange box of "Diminishing Returns." This is the critical inflection point where the cost of upkeep outweighs the benefit of the solution.
The true danger lies in the "Feedback Loop" indicated by the dashed line. As the system enters "System Fragility," it loses the very capacity to solve problems that triggered the complexity in the first place. The state becomes rigid, brittle, and heavily indebted. When a "Crisis Event"—be it an ancient drought or a modern pandemic—strikes the bottom-left red box, the brittle structure cannot bend. It snaps. The result is the final red box: a "Collapse" that resets the entire system back to a state of forced simplicity.
The 12,000-Year Flatline
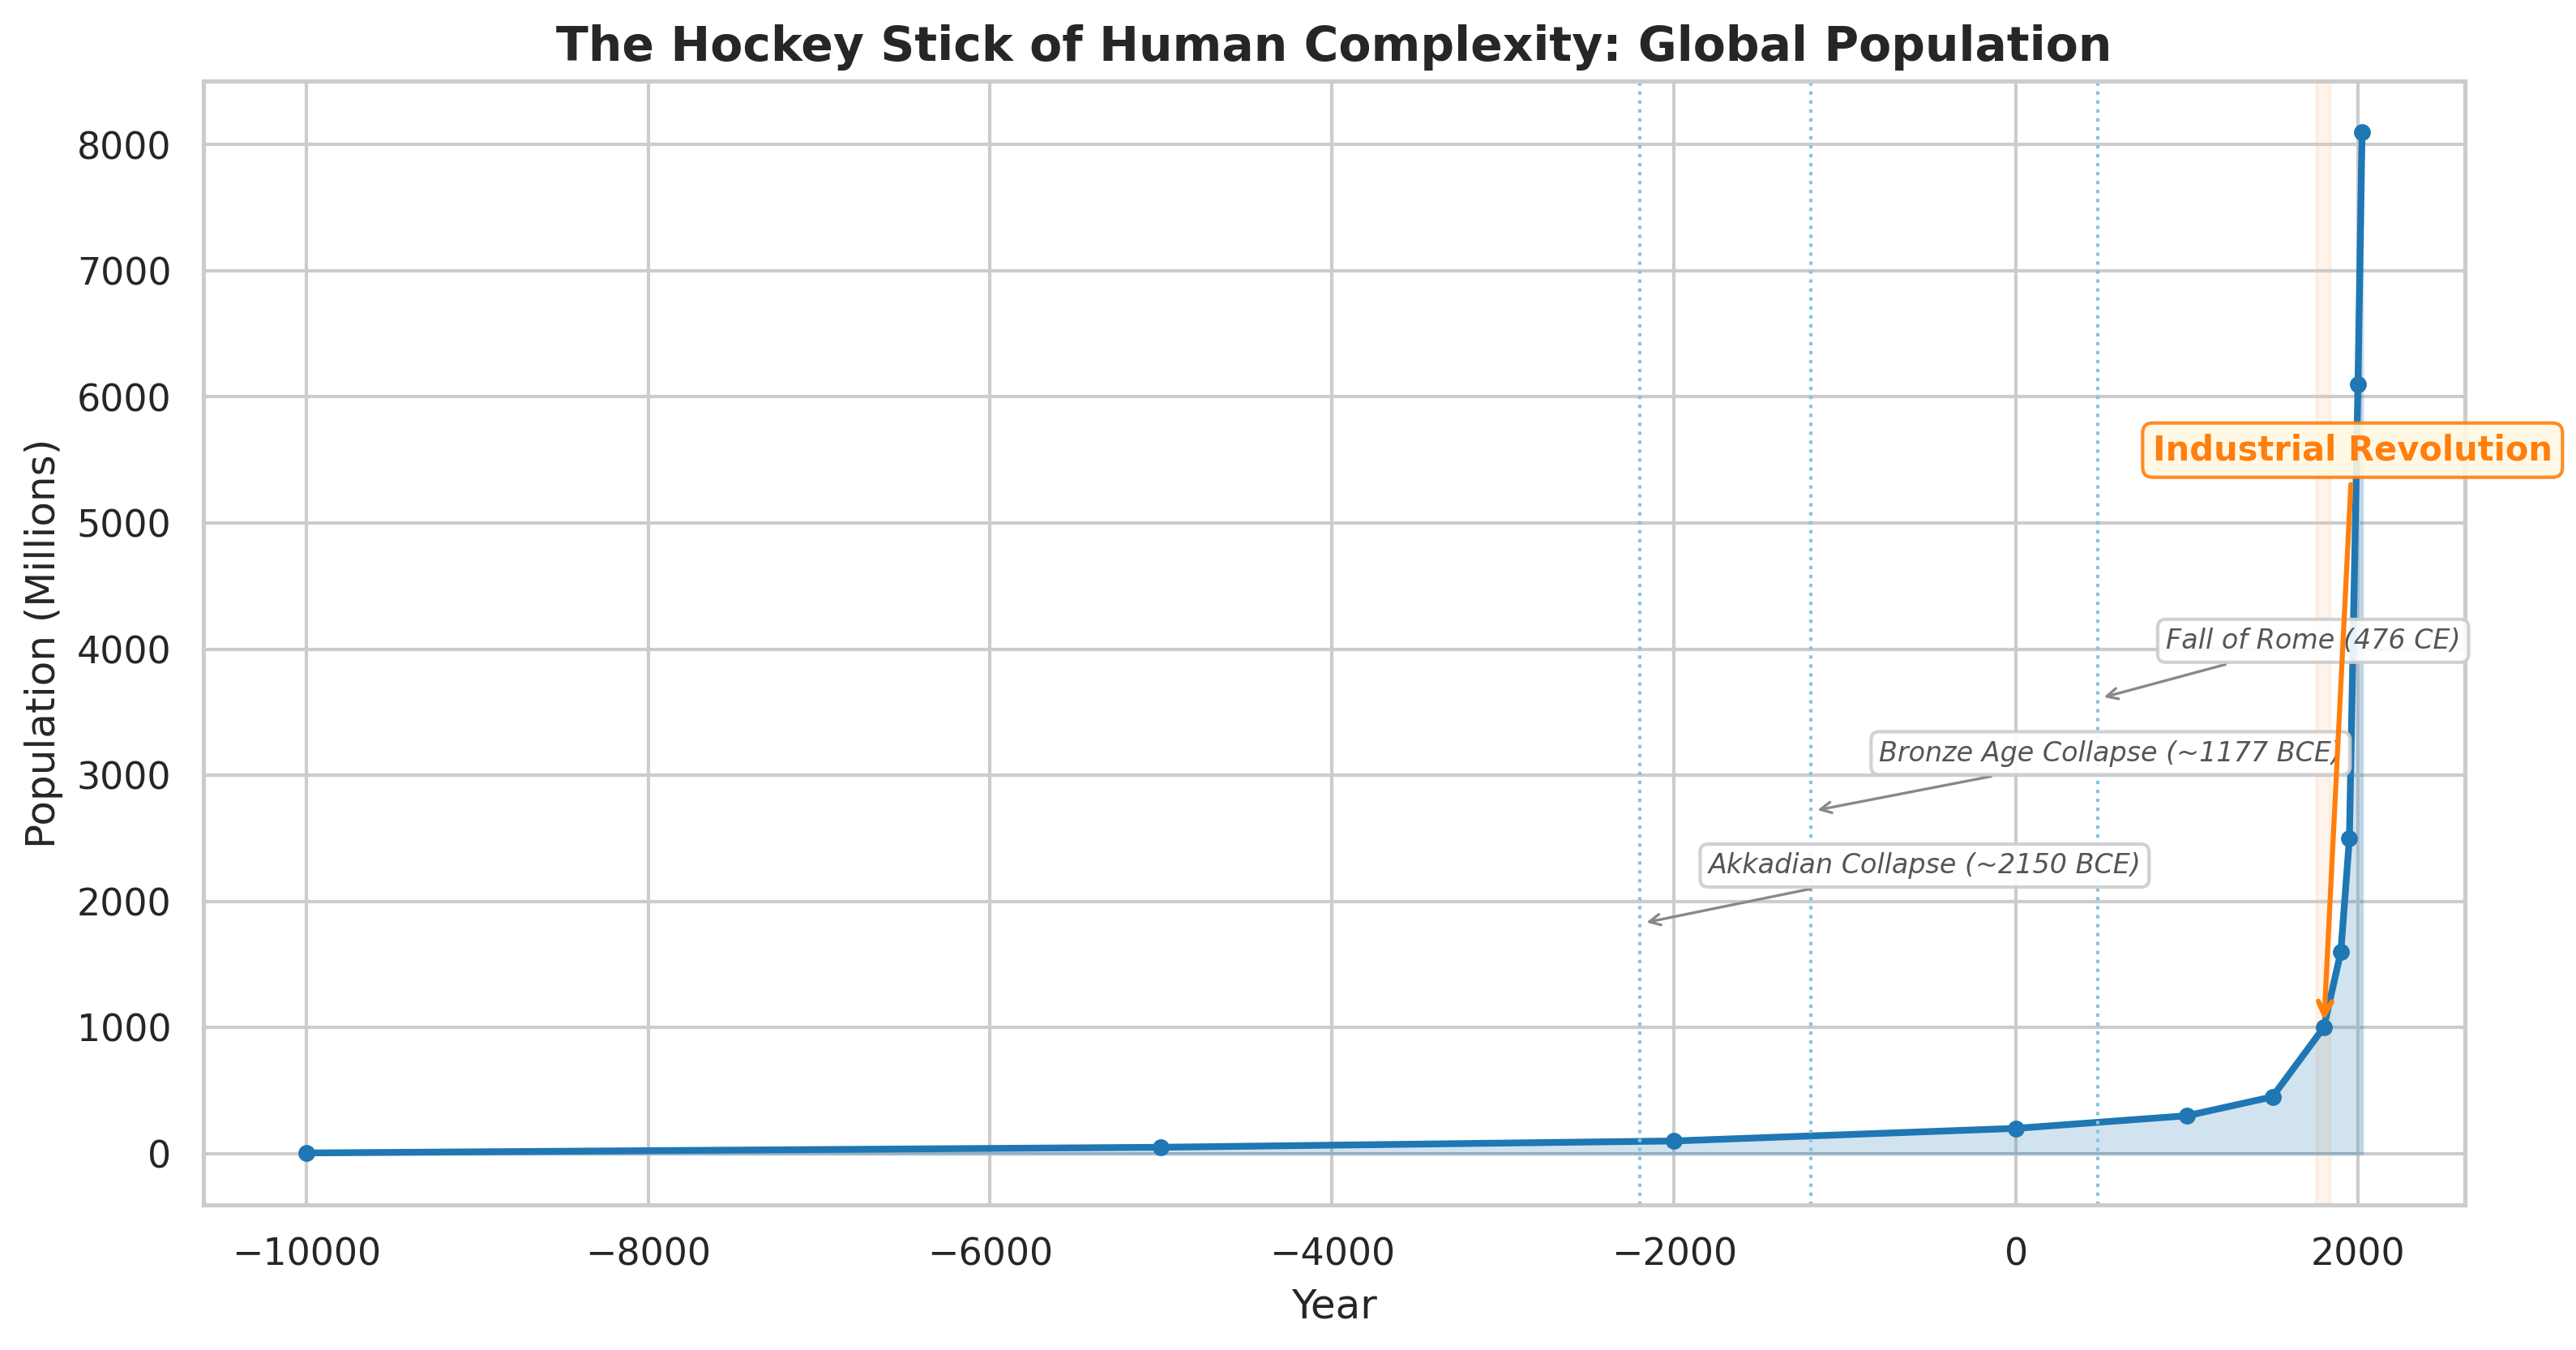
For 12,000 years, human population hugged the bottom of the graph, a faint blue trace of survival. Then, at the 1800 mark, the chart hits a wall and turns into a rocket ship, soaring from 1 billion to over 8 billion in just two centuries.
The chart above illustrates the unprecedented scale of our current iteration. Start at the left, 10,000 years before the common era. You can barely see the blue line against the axis. Even the great collapses of the past—the Akkadian, the Bronze Age, the Roman—appear as mere flickers because the total human "load" on the planet was so small. Notice the annotated dashed lines: the Akkadian collapse around 2150 BCE, the Bronze Age collapse around 1177 BCE, and the fall of Rome at 476 CE. Each of these was a catastrophe for the people who lived through it, yet on this scale they are invisible tremors.
Humanity entered a "Phase Change" at the 1800 mark: the Industrial Revolution. Fossil fuels, mechanized agriculture, and modern medicine broke the Malthusian ceiling that had constrained every previous civilization. But this level of complexity requires a massive reserve of problem-solving capacity (Tainter, 1988). When the line is this steep, any stumble becomes a fall. We have outrun the Five Horsemen only temporarily through the sheer velocity of industrial growth. The question is what happens when the road narrows.
The Staircase to Oblivion: Rome's Currency Crisis
The Romans learned the answer to that question through their currency. To maintain a military that stretched from Hadrian's Wall to the Euphrates, the Empire needed silver. When the mines ran dry and the costs of bureaucracy mounted, emperors turned to the only tool they had left: debasement. They didn't raise taxes; they simply "shaved" the value of the money.
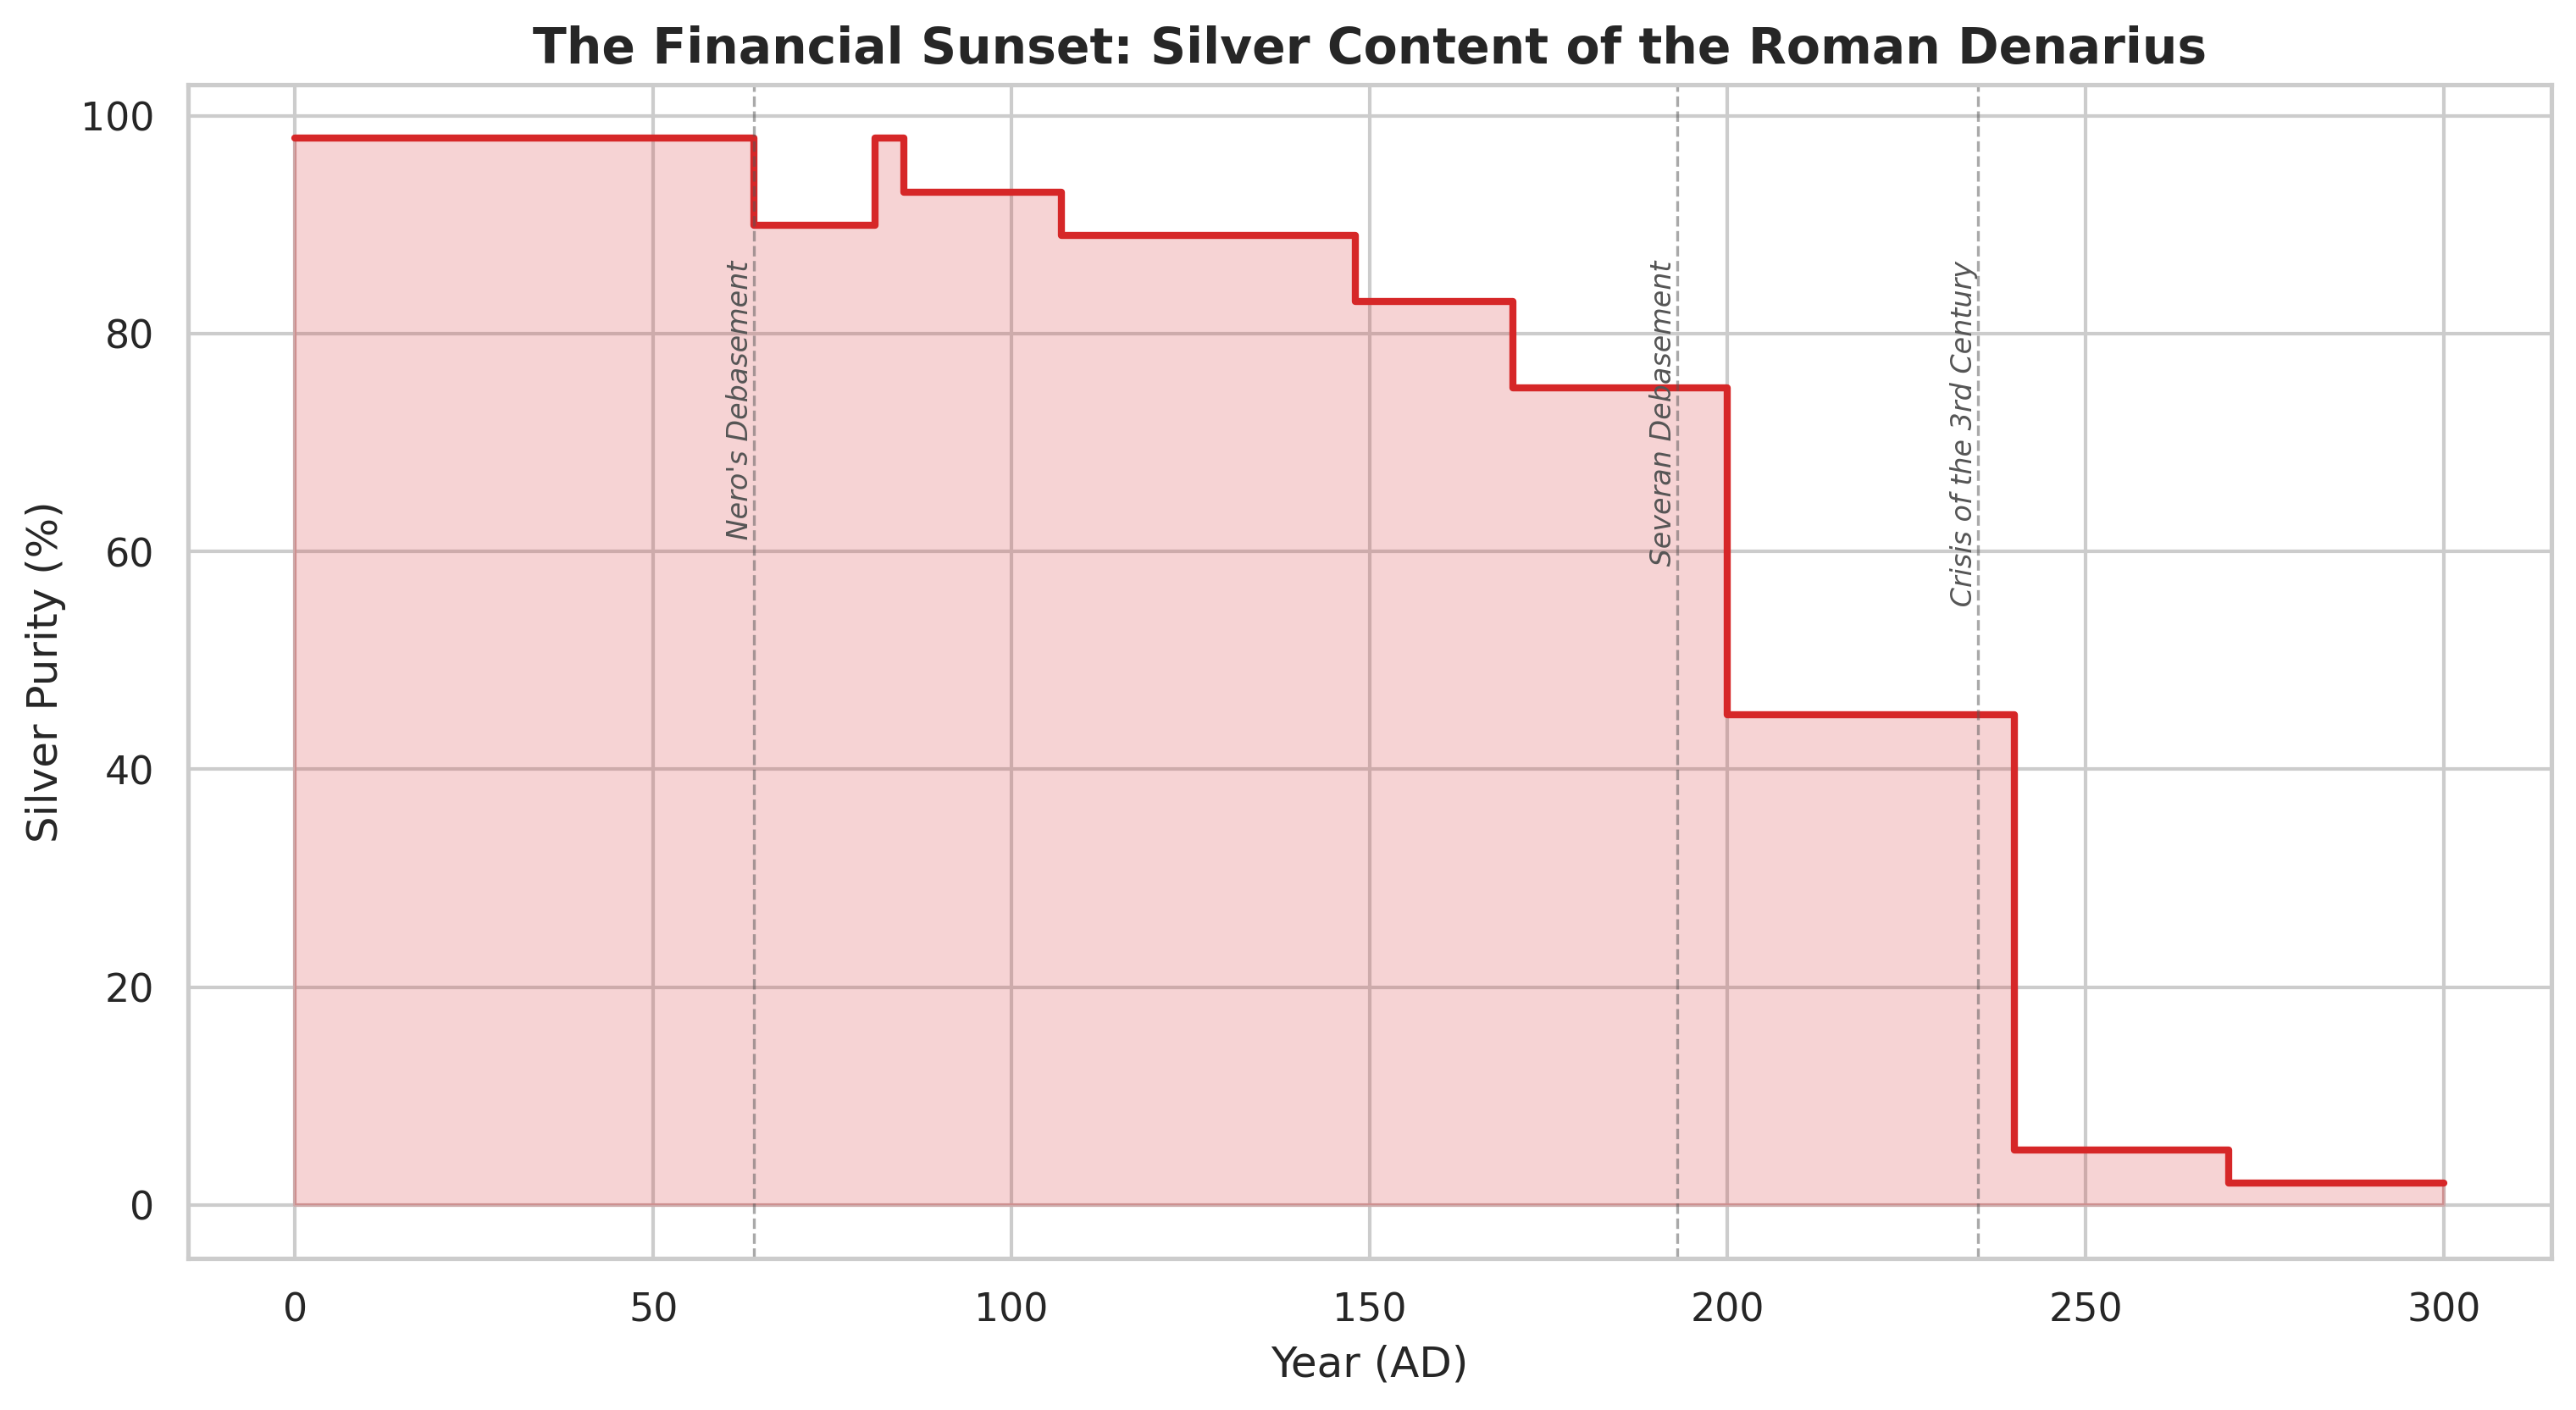
The staircase to oblivion. The red line represents the silver purity of the Denarius, which sat at near 100% for decades before beginning an agonizing, step-wise descent into the base-metal basement of the 3rd century.
The Roman debasement chart is a visual autopsy of a dying system. Start at the top left, under Augustus, where the Denarius was a proud 98% silver. Notice the first small step down at 64 AD—Nero's first nibble at the currency. For over a century, the Empire maintained a plateau around 80-90%, a slow but manageable erosion that funded expansion and kept the legions paid. But the cliff that begins around 193 AD tells a different story. This was the Severan debasement, where the line plunges from 75% to under 50% in the span of a single dynasty. By the time we reach the "Crisis of the 3rd Century" at 235 AD, the line is hugging the bottom of the chart at a mere 2-5% purity. The Romans tried to pay for 1st-century complexity with 3rd-century "ghost money." It failed. Resulting hyperinflation shattered Mediterranean trade routes, and with them, the Five Horsemen rode in: disease swept through weakened populations, barbarian migrations breached undefended borders, and the state fragmented into rival claimants.
The Silicon Precipice: Modernity's Brittle Edge
Today, we face a different kind of debasement: the debasement of resilience. Our complexity is digital. We have traded self-sufficiency for the efficiency of the "just-in-time" supply chain—a system that works perfectly until the internet or the electricity fails.
A "strong oscillation" in the grid paralyzed the Iberian Peninsula overnight during the 2025 blackout. Hospitals held their breath on backup generators, but the real collapse happened at the checkout counter. Electronic payment systems—from Apple Pay to Bizum—evaporated. ATMs, unable to "talk" to their home servers, became useless blocks of plastic and glass. In a world without physical cash, the simple act of buying bread or medicine became impossible. This 21st-century reset, triggered by a rare atmospheric phenomenon, proves that our highest achievements are built on the shakiest of foundations.
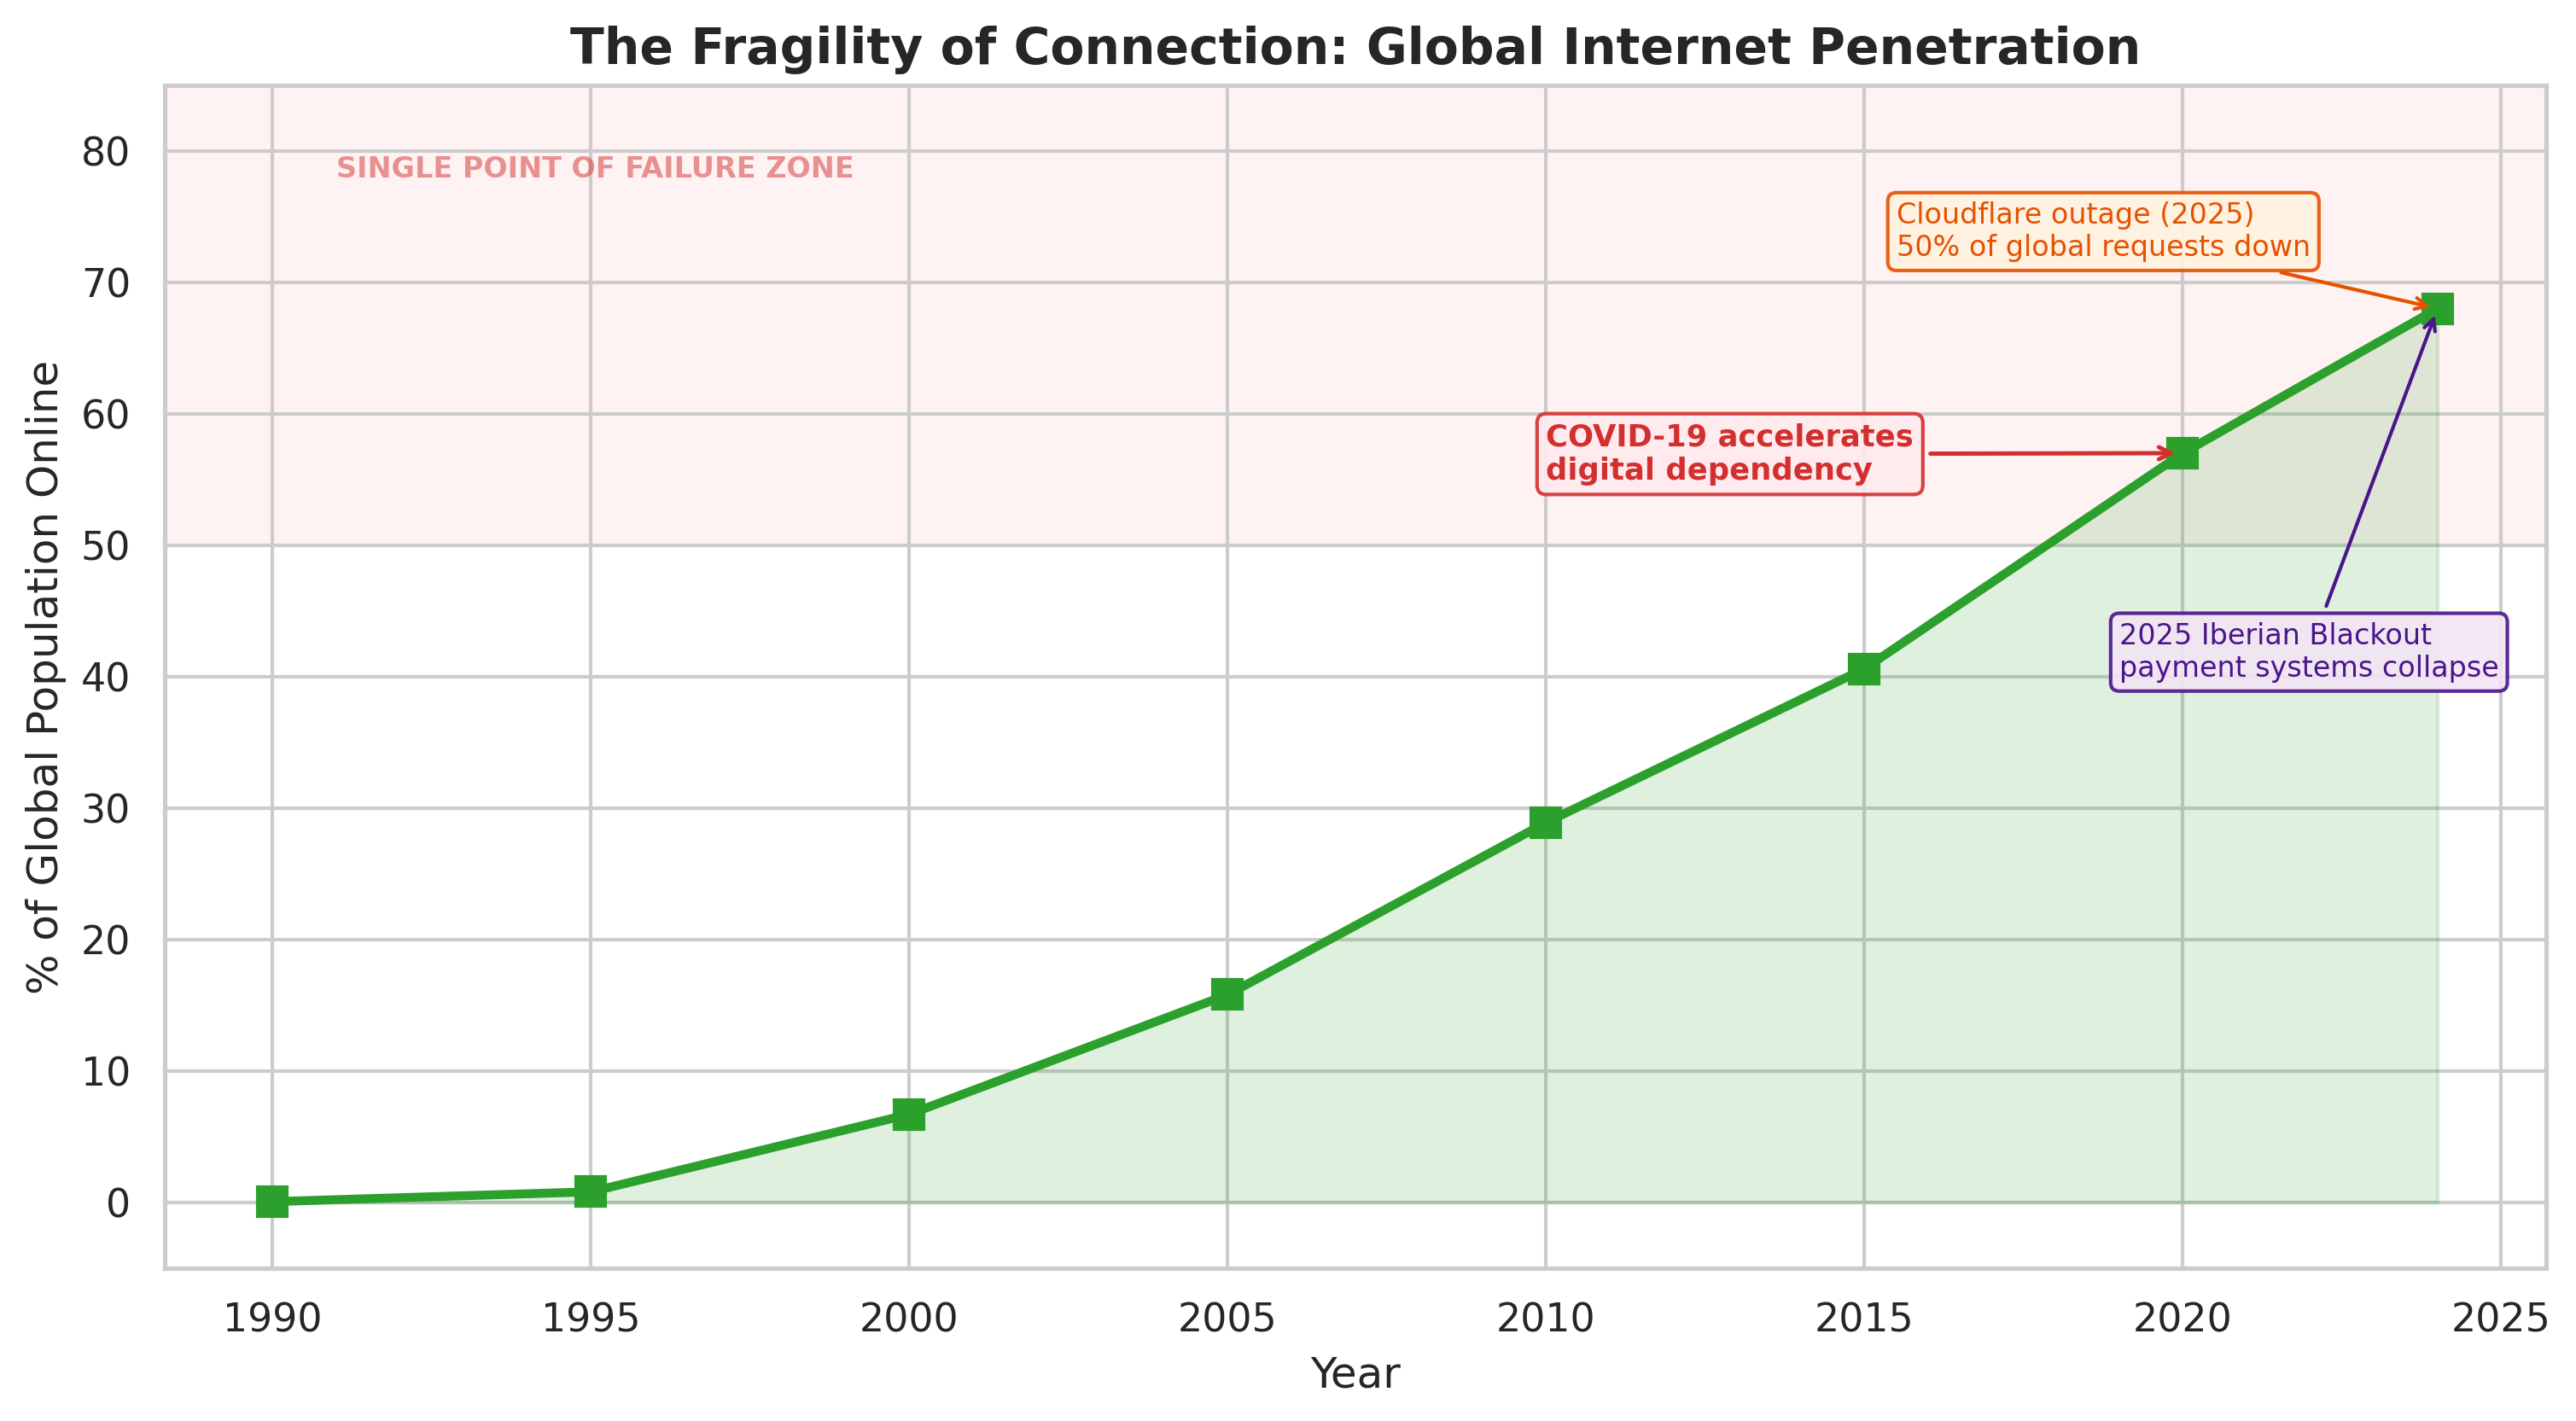
From nearly zero to 68% in thirty-four years. The green area represents more than just users; it represents the percentage of our collective survival that is now dependent on a functioning global network. The red-shaded zone marks the threshold where dependency becomes a single point of failure.
Digital dependency traces a deceptively smooth path across the 21st century. In 1990, the internet was a laboratory curiosity used by a fraction of a percent of the population. By 2024, the line has climbed to 68%. But the annotations on this chart tell the real story. The COVID-19 pandemic in 2020 didn't just accelerate adoption; it made digital infrastructure a survival dependency. Grocery delivery, telemedicine, and remote schooling became lifelines. When Cloudflare suffered a global cascading failure in November 2025, 50% of global requests were met with silence. Platforms from ChatGPT to major banking portals flickered out of existence for hours. This was not a cyberattack, but a self-inflicted wound caused by a database configuration file that exceeded internal limits. The chart's faint red band above 50%—the "Single Point of Failure Zone"—is an engineering reality.
This fragility isn't just digital; it's physical. In March 2021, the Ever Given container ship wedged itself into the banks of the Suez Canal. For six days, 12% of global trade—roughly $9.6 billion worth of goods per day—ground to a halt.
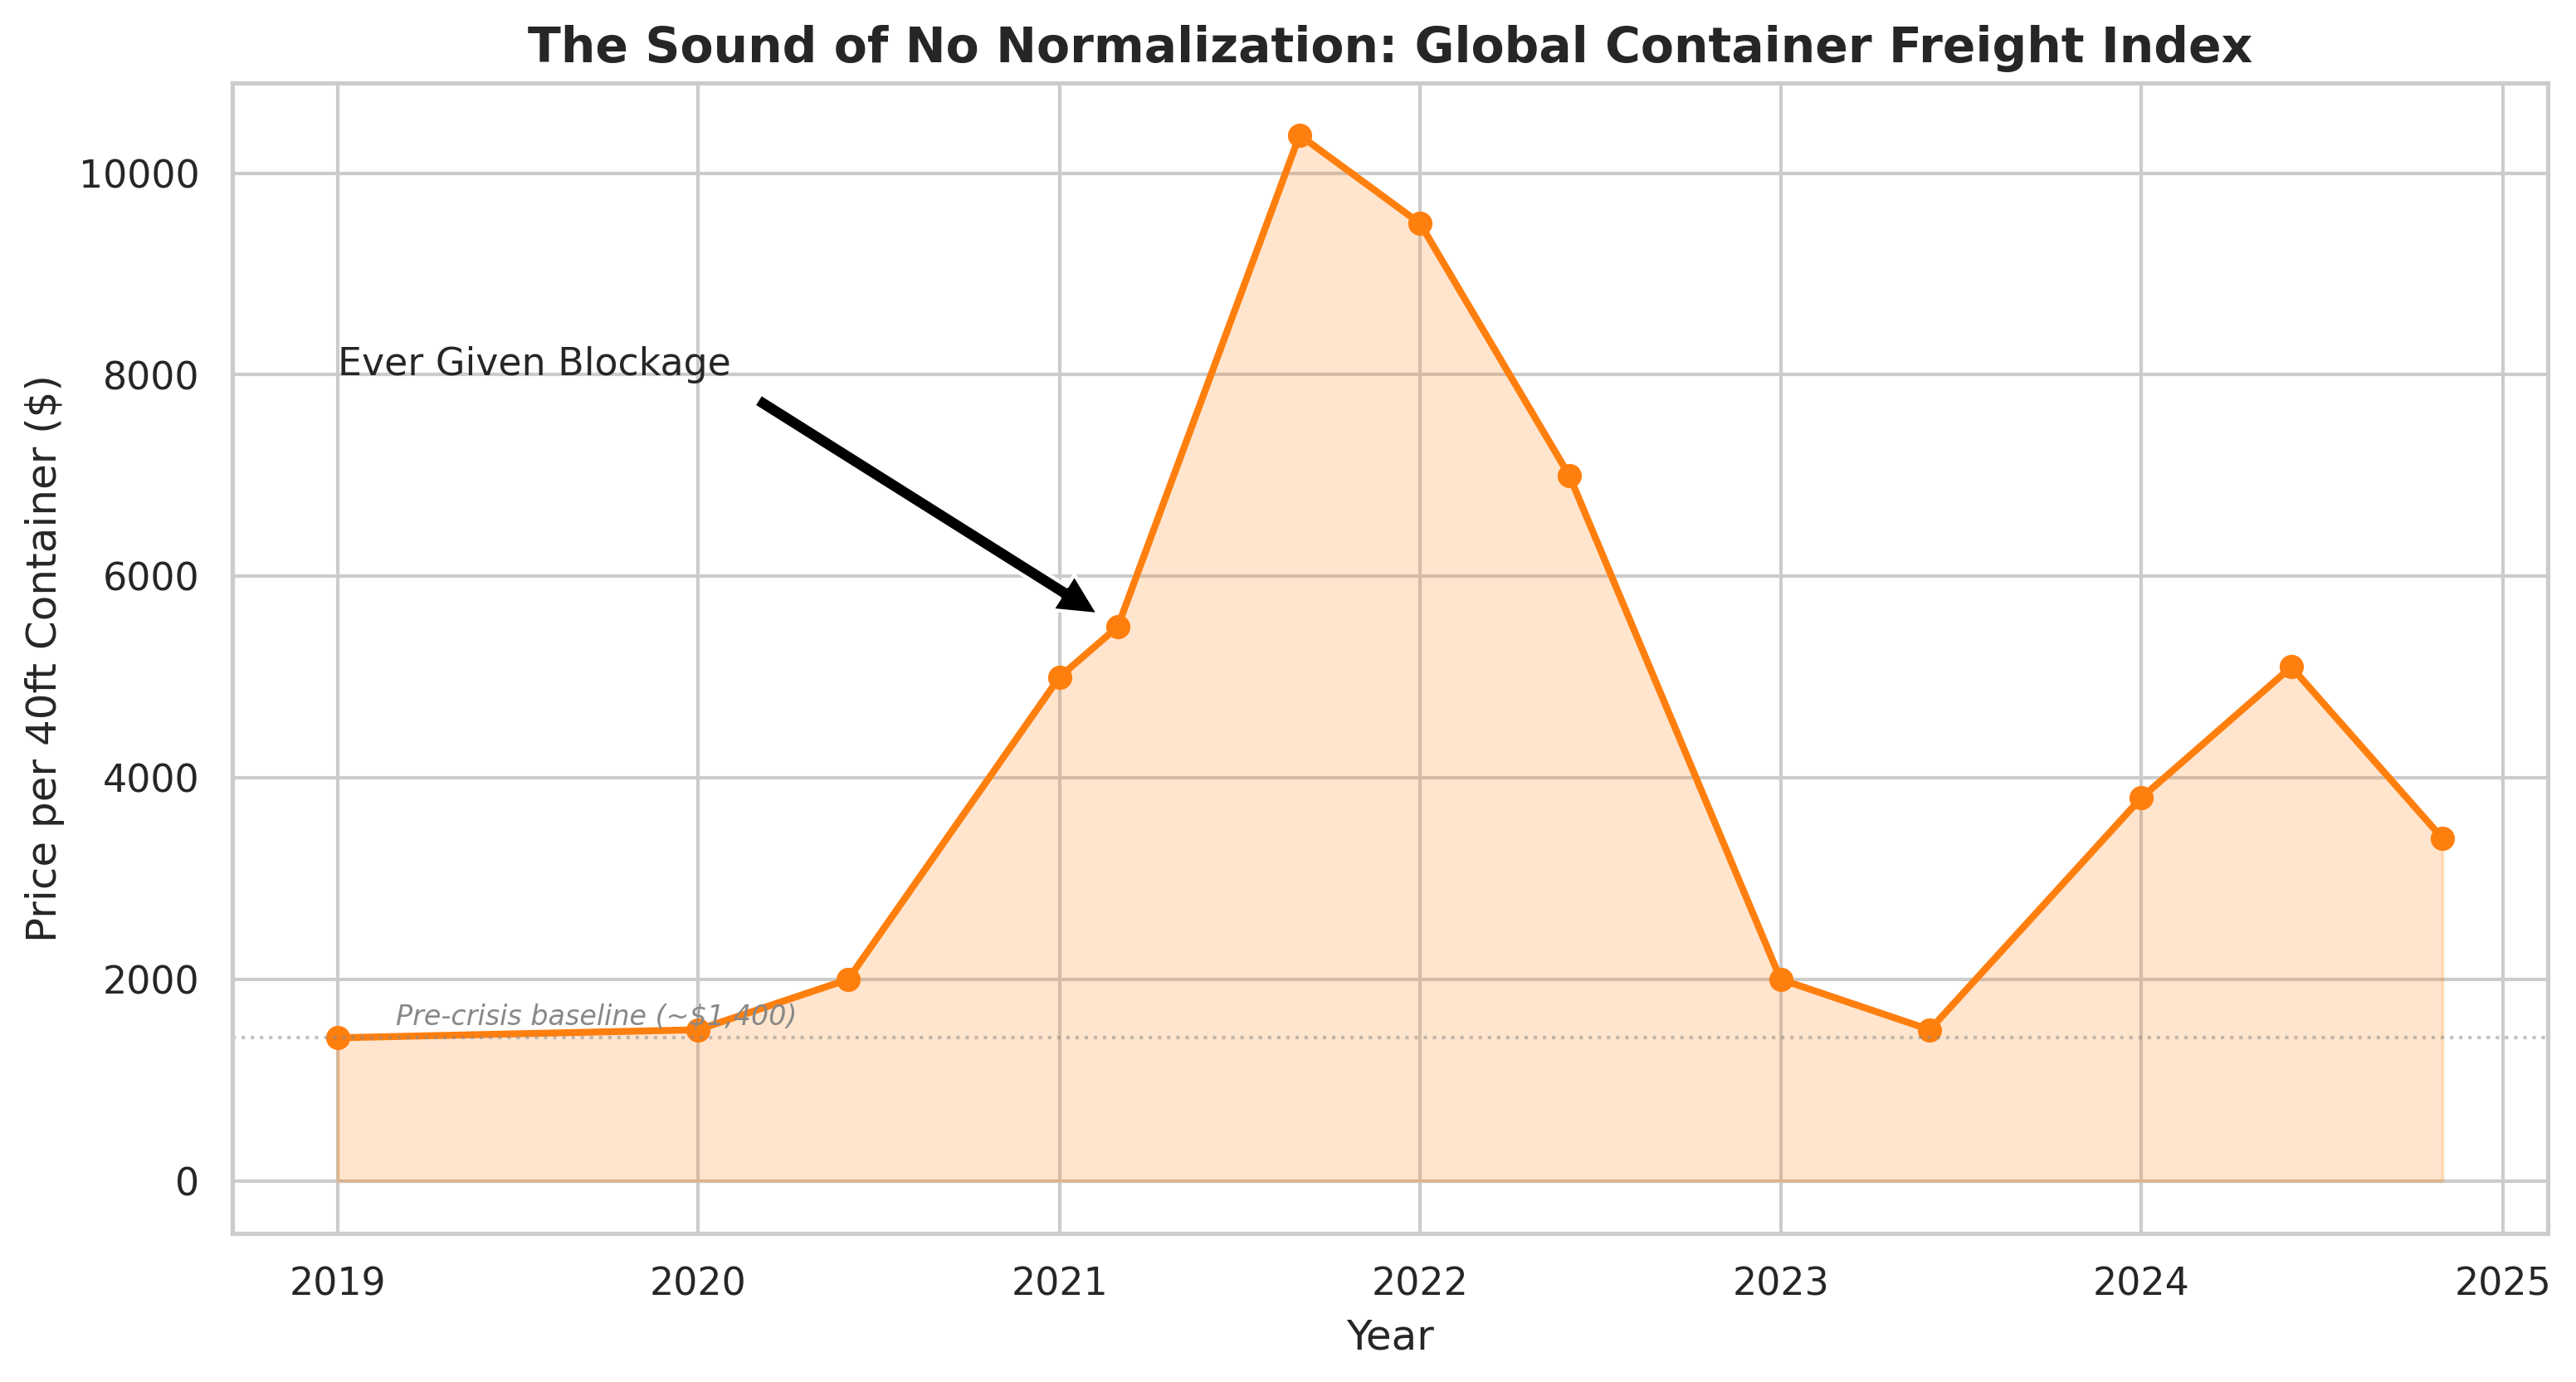
Start with the flatline of 2019. The orange area shows a stable base of ~$1,400 per container, marked by the dotted baseline. Then look at the vertical cliff after March 2021. The index doesn't just spike; it explodes to over $10,000—a nearly 600% increase—and even after the 'correction,' it refuses to return to the pre-collapse normal.
The Ever Given blockage acted as a "force multiplier" for chaos at the tail end of the pandemic. It didn't just delay goods; it shattered the global container pool. Look at that orange peak. We were told these were "transitory" spikes, but notice the 2024 tail of the chart. Even after the 2023 dip back toward $1,500, the line bends upward again, peaking near $5,100 in mid-2024. We have entered an era where "price normalization" is a myth; we see only minor corrections before systemic fragility drives costs back up. When the Suez closes or Cloudflare blinks, the global machine does not just slow down; it breaks.
The Monopoly of the Monolith
If the Romans were vulnerable because they relied on a single source of silver, we are vulnerable because we rely on a single source of silicon. Our modern "mines" are owned by a handful of entities.
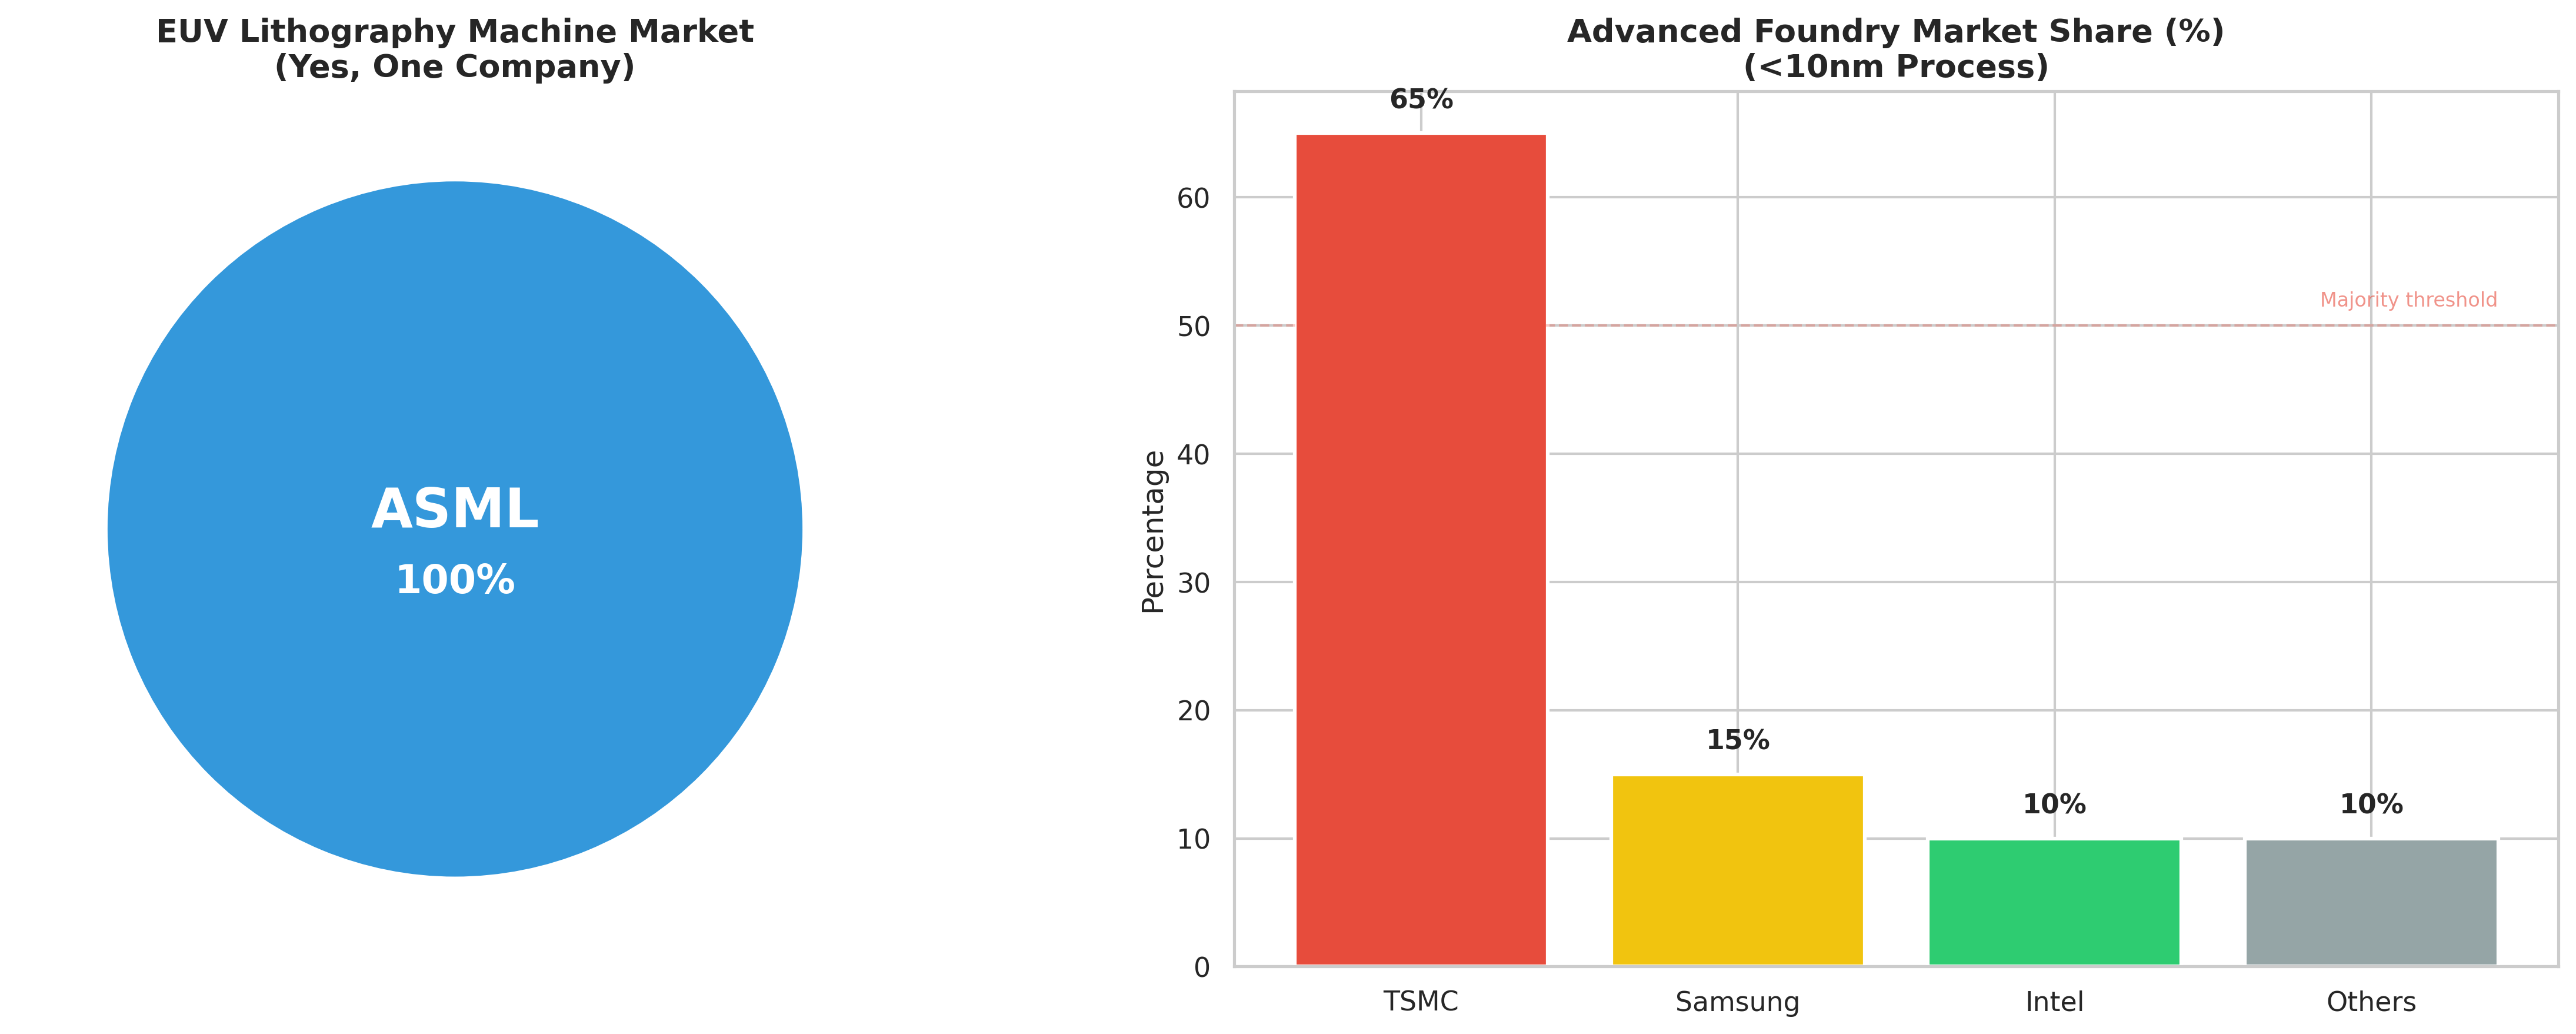
Visualizing the bottleneck. On the left, a solid blue circle with two words in the center: ASML, 100%. One Dutch company builds every extreme ultraviolet lithography machine on Earth. On the right, a foundry landscape where one island—TSMC in Taiwan—carries 65% of the world's advanced processing load, towering above all competitors combined.
The explosive growth of Artificial Intelligence has currently triggered a global RAM shortage—specifically High Bandwidth Memory (HBM). Data centers are devouring the world’s supply, with major manufacturers reporting they are sold out through 2025. Because HBM production is three times more complex than standard memory, manufacturers are reallocating capacity, driving up prices for every consumer device on the planet.
This is the ultimate bottleneck. As the charts above show, the semiconductor chain is a series of nested monopolies. If any single link in this chain snaps—whether due to a geopolitical "strong oscillation" over Taiwan or a physical crisis at ASML’s Veldhoven campus—the cascading impact would make the 3rd-century Roman crisis look like a minor accounting error. We have built a fragile machine that requires 100% uptime just to meet basic needs.
The Ghost Money of the 21st Century
This fragility is mirrored in our modern financial complexity. Much like the Romans, we have responded to the "tectonic stresses" of our era by expanding the money supply to keep the machine running.
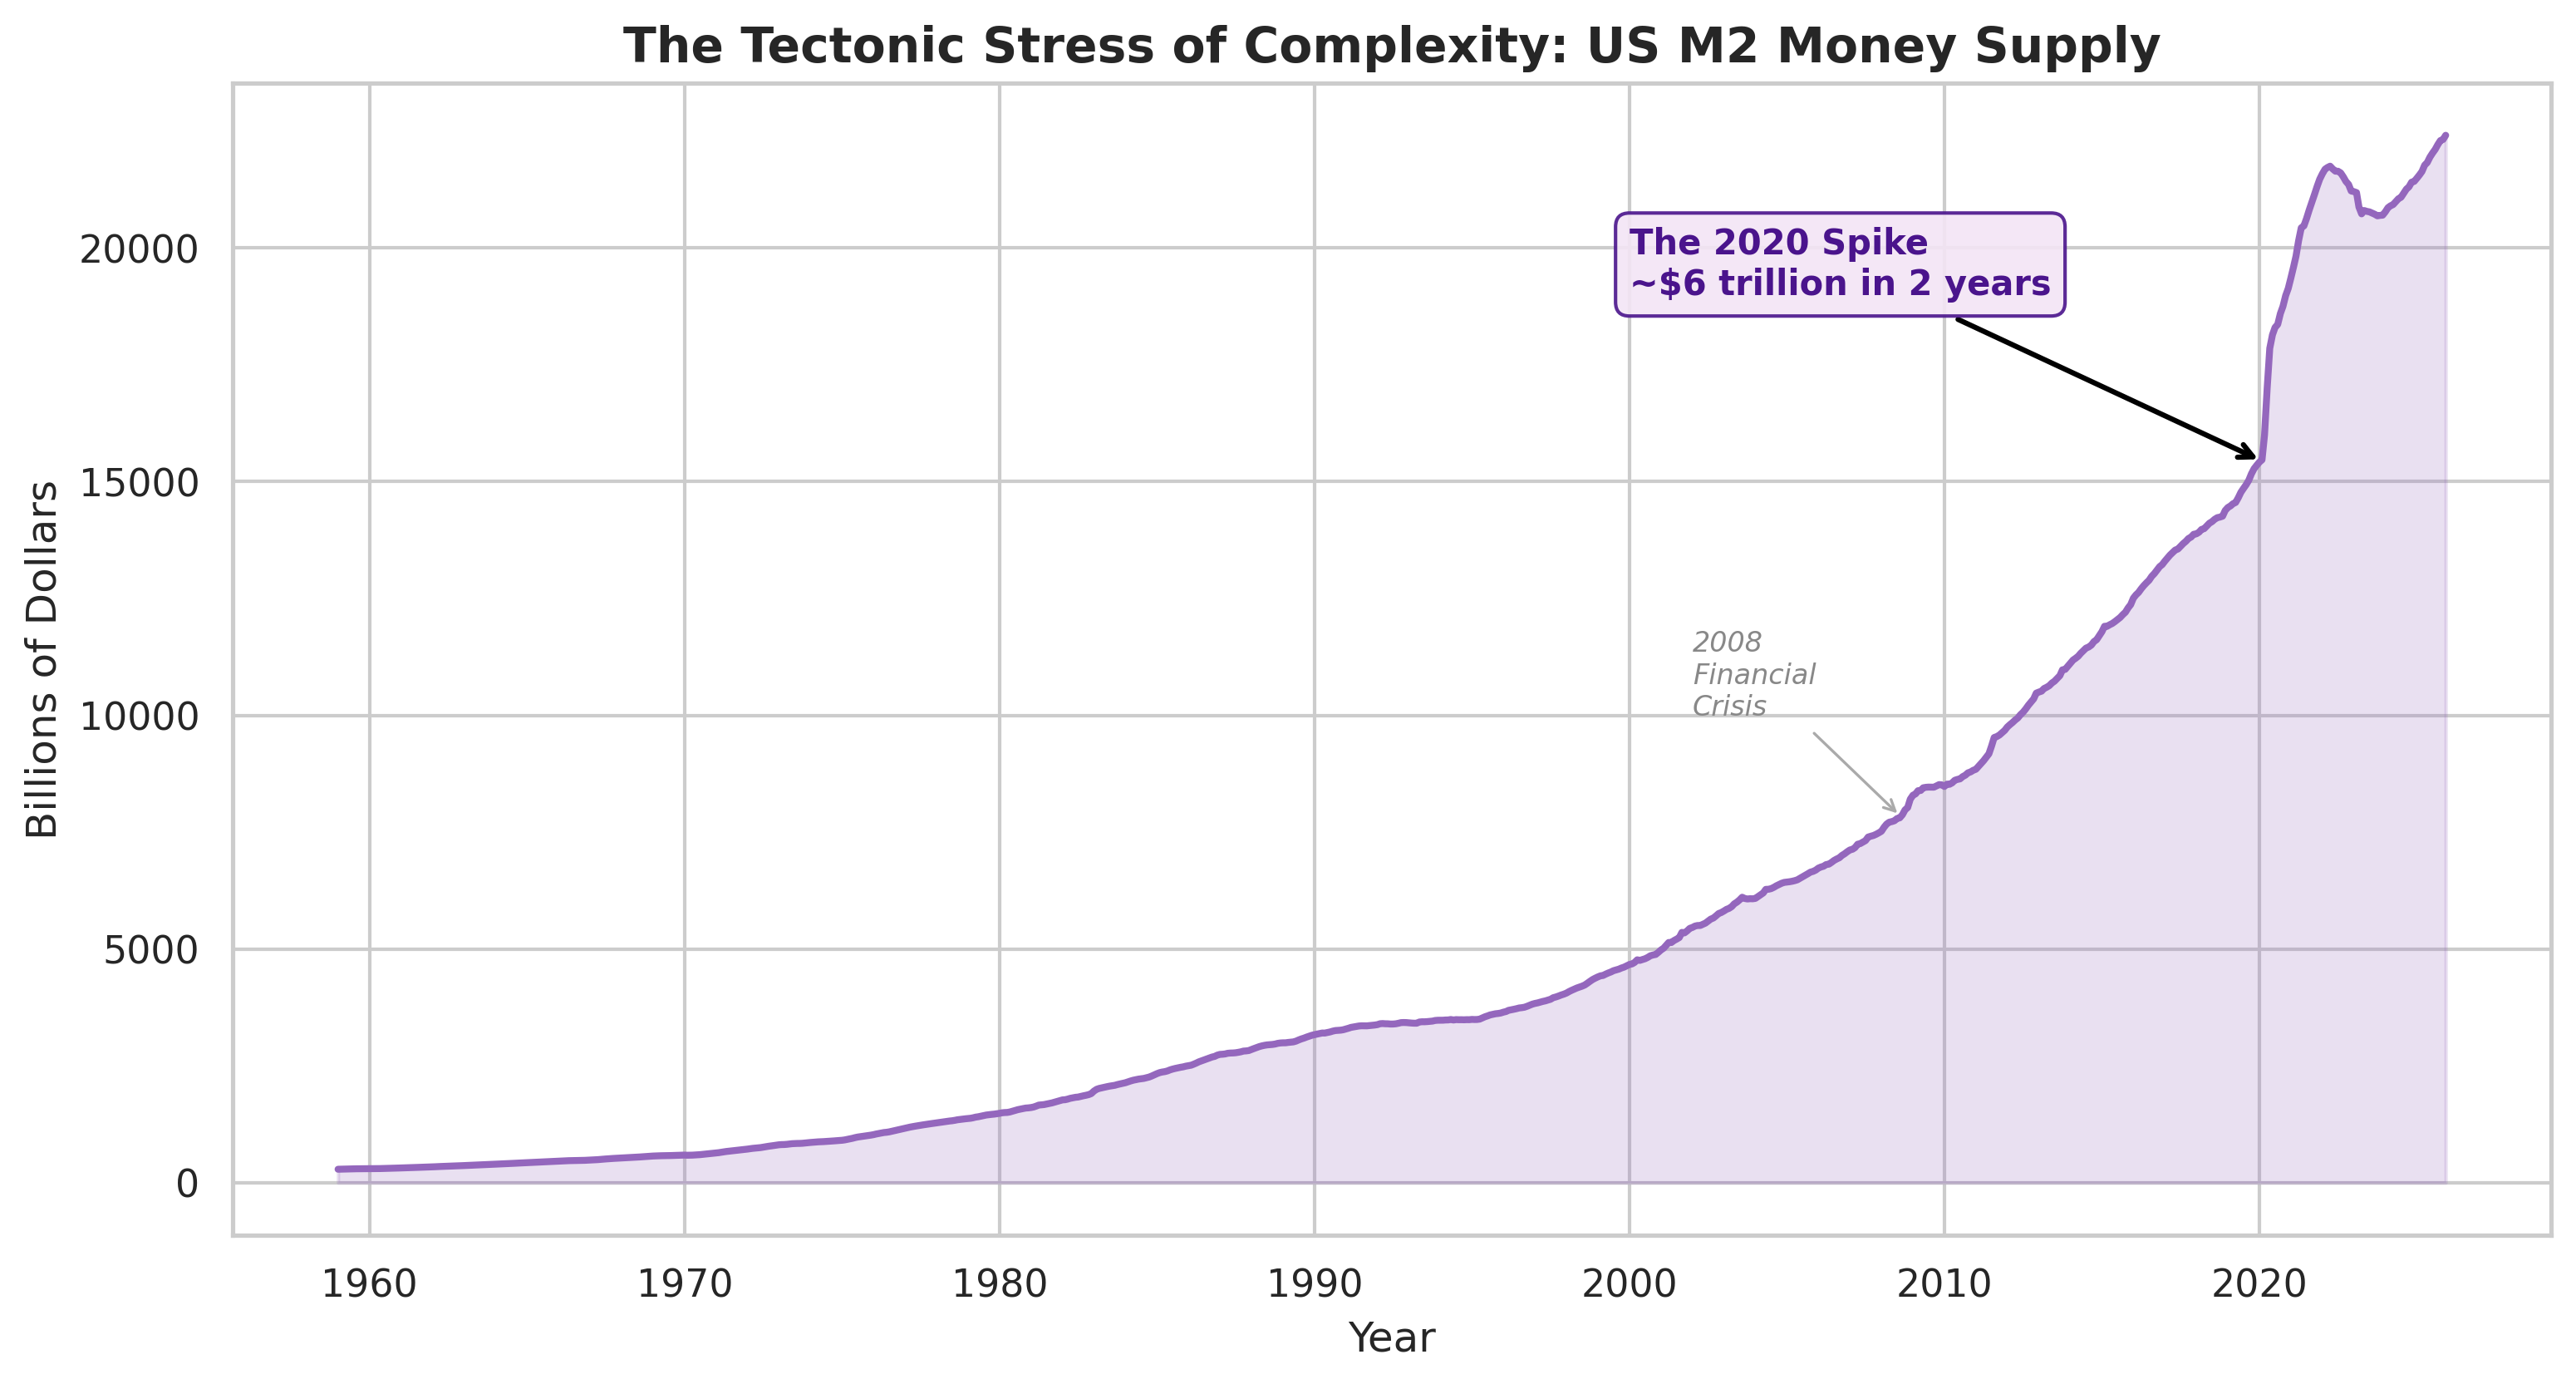
The purple curve is a classic exponential growth pattern, but pay attention to the 2020 mark. That near-vertical spike represents roughly $6 trillion appearing in the US money supply in under two years—the modern equivalent of Nero's first nibble at the Denarius, executed at industrial scale.
The M2 money supply chart shows the final stage of the complexity trap. For fifty years, the line was a gentle slope, barely noticeable against the axis. Even the 2008 financial crisis appears as a manageable bump, a moment when the system strained but held. But the "2020 Spike" is different. This near-vertical line is a visual representation of a system that has become so complex and so fragile that it requires massive, unprecedented interventions just to prevent a "Game Over" event. The Federal Reserve printed more money in two years than in the previous four decades combined. We are walking a narrowing tightrope (Morris, 2010). The Akkadians had their drought. The Romans had their silver. We have our printer.
Avoiding the Reset: The Prosperous Way Down
Are we doomed? Not necessarily. History shows that some civilizations managed to navigate the Complexity Trap without a full collapse. The Tang Dynasty in China, after the devastating An Lushan Rebellion of 755 CE, deliberately decentralized its administration, granting provinces greater autonomy and reducing the cost of the central bureaucracy. The Empire contracted but survived for another 150 years. The Eastern Roman Empire, faced with the loss of its western provinces, shed the expensive fiction of universal rule, consolidated around Anatolia and the Aegean, and built a leaner, more defensible state that outlasted its western counterpart by a thousand years. In both cases, survival came not from doubling down on complexity, but from strategic simplification.
The lesson for our era is the same, though the specifics differ. The "Prosperous Way Down"—a concept from Howard and Elisabeth Odum (2001)—suggests that we must choose a managed descent—a deliberate simplification of our systems—before a chaotic collapse chooses it for us. In practice, this means three things.
First, redundancy over efficiency. The just-in-time supply chain is a marvel of cost-cutting, but the Suez Canal and the Iberian blackout proved that efficiency without redundancy is fragility by another name. Localizing food production, maintaining physical cash infrastructure, and diversifying semiconductor manufacturing are not luxuries. They are insurance policies against the next "strong oscillation."
Second, decoupling survival from 100% digital uptime. When 68% of the planet depends on a network that a single misconfigured database can cripple, we have not built progress. We have built a trap. Critical systems—power grids, water treatment, and emergency communications—need analog fallbacks that function when the cloud disappears.
Third, stopping the silver-shaving. The M2 chart shows us printing our way out of every crisis, each time at a larger scale. The Romans proved this strategy has an expiration date. Fiscal resilience means building buffers during good times, not spending them in advance.
The Five Horsemen of collapse—population pressure, disease, state failure, trade disruption, and climate change—are not relics of the ancient world. They are riding today, visible in every chart in this essay. The 5,000-year-old history of empires, metal, and money still has something to say. We must listen before the dust begins to carry more than rain.